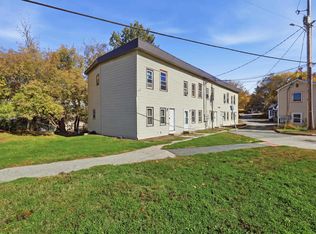
Great investment opportunity in Claremont! This fully rented 2-unit multifamily property is conveniently located and offers a great addition to any investment portfolio. Each unit features 2 bedrooms and 1 bathroom, providing comfortable and functional living spaces. With both units currently leased and tenants responsible for all utilities, this property offers an attractive setup for investors. Whether you're looking to start your investment portfolio or expand an existing one, this income-producing property is an opportunity worth exploring! Other properties to look at if wanting to purchase portfolio as a whole mls#5514894, 5114895, 5114896
Active
Listed by: EXP Realty • Tanya Roux • 888-398-7062
$109,000
8 Wall Street, Claremont, NH 03743
4beds
1,120sqft
Multi Family
Built in 1920
-- sqft lot
$167,800 Zestimate®
$97/sqft
$-- HOA
What's special
- 2 days
- 408
- 47
Zillow last checked:
Listing updated:
Listed by:
Tanya Roux,
EXP Realty Cell:603-860-1812
Source: PrimeMLS,MLS#: 5114897
Facts & features
Interior
Bedrooms & bathrooms
- Bedrooms: 4
- Bathrooms: 2
- Full bathrooms: 2
Heating
- Electric
Cooling
- None
Features
- Flooring: Carpet, Vinyl, Vinyl Plank
- Basement: Unfinished,Interior Entry
Interior area
- Total structure area: 1,616
- Total interior livable area: 1,120 sqft
- Finished area above ground: 1,120
- Finished area below ground: 0
Property
Features
- Levels: Two,Multi-Level
Lot
- Size: 1,742 Square Feet
- Features: City Lot, Corner Lot
Details
- Parcel number: CLMNM120L183
- Zoning description: PR
Construction
Type & style
- Home type: MultiFamily
- Property subtype: Multi Family
Materials
- Wood Frame, Vinyl Siding
- Foundation: Stone
- Roof: Architectural Shingle
Condition
- New construction: No
- Year built: 1920
Utilities & green energy
- Electric: Circuit Breakers
- Sewer: Public Sewer
- Water: Public
- Utilities for property: Cable Available, Fiber Optic Internt Avail
Community & HOA
Location
- Region: Claremont
Financial & listing details
- Price per square foot: $97/sqft
- Tax assessed value: $101,700
- Annual tax amount: $3,106
- Date on market: 10/19/2026
Estimated market value
$167,800
$146,000 - $190,000
$1,967/mo
Price history
| Date | Event | Price |
|---|---|---|
| 10/19/2026 | Listed for sale | $109,000-3.1%$97/sqft |
Source:  PrimeMLS #5114897 Report a problem | ||
| 1/11/2024 | Sold | $112,500-13.5%$100/sqft |
Source: PrimeMLS #4974676 Report a problem | ||
| 1/10/2024 | Contingent | $130,000$116/sqft |
Source: PrimeMLS #4974676 Report a problem | ||
| 11/12/2023 | Price change | $130,000-7.1%$116/sqft |
Source: PrimeMLS #4974676 Report a problem | ||
| 10/18/2023 | Listed for sale | $139,900+107.3%$125/sqft |
Source: PrimeMLS #4974676 Report a problem | ||
| 4/28/2022 | Sold | $67,500$60/sqft |
Source: PrimeMLS #4902954 Report a problem | ||
| 3/31/2022 | Contingent | $67,500$60/sqft |
Source: PrimeMLS #4902954 Report a problem | ||
| 3/30/2022 | Listed for sale | $67,500+28.6%$60/sqft |
Source: PrimeMLS #4902954 Report a problem | ||
| 12/9/2017 | Listing removed | $52,500$47/sqft |
Source: CENTURY 21 Highview Realty #4639601 Report a problem | ||
| 6/8/2017 | Listed for sale | $52,500+16.7%$47/sqft |
Source: Century 21 Highview Realty #4639601 Report a problem | ||
| 11/26/2014 | Listing removed | $799$1/sqft |
Source: Century 21 Highview Realty #4391395 Report a problem | ||
| 11/9/2014 | Price change | $799-11.1%$1/sqft |
Source: Century 21 Highview Realty #4391395 Report a problem | ||
| 11/1/2014 | Listed for rent | $899$1/sqft |
Source: Century 21 Highview Realty #4391395 Report a problem | ||
| 4/25/2014 | Sold | $45,000+172.7%$40/sqft |
Source: Public Record Report a problem | ||
| 6/20/2013 | Sold | $16,500-41.1%$15/sqft |
Source: Public Record Report a problem | ||
| 6/20/2001 | Sold | $28,000$25/sqft |
Source: Public Record Report a problem | ||
Public tax history
| Year | Property taxes | Tax assessment |
|---|---|---|
| 2024 | $2,976 +5.3% | $101,700 |
| 2023 | $2,827 +33.5% | $101,700 +100.2% |
| 2022 | $2,117 +1.7% | $50,800 |
| 2021 | $2,082 +0.6% | $50,800 |
| 2020 | $2,069 +1.2% | $50,800 |
| 2019 | $2,045 +12% | $50,800 +17.1% |
| 2018 | $1,826 -1.4% | $43,400 |
| 2017 | $1,851 +0.1% | $43,400 |
| 2016 | $1,850 +2.8% | $43,400 |
| 2015 | $1,800 +0.3% | $43,400 |
| 2014 | $1,794 -21.1% | $43,400 -30.8% |
| 2013 | $2,273 +5.5% | $62,700 |
| 2012 | $2,155 -3.8% | $62,700 -7.1% |
| 2011 | $2,240 +5.9% | $67,500 |
| 2010 | $2,115 +10.8% | $67,500 +7.7% |
| 2009 | $1,909 +1131.6% | $62,700 |
| 2008 | $155 | $62,700 |
Find assessor info on the county website
Monthly payment
Est. payment
Payment breakdown
Explore the cost of this home by adjusting the details. Changes won't be saved.Climate risks
Neighborhood: 03743


Similar homes
- $99,0002 bd1 ba784 sqft5 Raymond Place, Claremont, NH 03743Active
 MLS ID #5108305, April Shepard. PrimeMLS
- $119,0003 bd1 ba820 sqft318 Britton Road, Unity, NH 03743Active
 MLS ID #5097470, Don Chabot. PrimeMLS
- $110,0003 bd1 ba1k sqft40 Blueberry Ridge Road, Newport, NH 03773Active
 MLS ID #5106911, DJ Chabot. PrimeMLS
- $99,0003 bd2 ba1.1k sqft17 Clement Road, Springfield, VT 05156Active
 MLS ID #5093193, Patrick Kelley. PrimeMLS
