Nice Quiet Street with 3br 2ba 2Stall Garage and over 2200 sq ft of living space+ 342sq ft Enclosed Deck. This Home Has Everything Updated And Move In Ready And Has Lots Of Built In Storage. New Flooring, Vanity, Countertop, New Gutters,Paint in 2026. New Water Heater 2022, New Central Air And Furnace In 2020, Fenced Yard.
For sale by owner
Price cut: $5K (10/19)
$169,900
807 Bourland Ave, Waterloo, IA 50702
3beds
1,738sqft
SingleFamily
Built in 1951
6,838 Square Feet Lot
$-- Zestimate®
$98/sqft
$-- HOA
What's special
New flooringFenced yardNew gutters
What the owner loves about this home
GREAT NEIGHBORHOOD!!!
- 29 days
- 1,059
- 93
Listed by:
Property Owner (641) 330-1271
Facts & features
Interior
Bedrooms & bathrooms
- Bedrooms: 3
- Bathrooms: 2
- Full bathrooms: 2
Heating
- Other, Other
Cooling
- Other
Features
- Flooring: Carpet, Linoleum / Vinyl
- Basement: Finished
- Has fireplace: Yes
Interior area
- Total interior livable area: 1,738 sqft
Property
Parking
- Parking features: Garage - Detached
Features
- Exterior features: Other
Lot
- Size: 6,838 Square Feet
Details
- Parcel number: 891335401015
Construction
Type & style
- Home type: SingleFamily
Materials
- Frame
- Foundation: Concrete Block
- Roof: Asphalt
Condition
- New construction: No
- Year built: 1951
Community & HOA
Location
- Region: Waterloo
Financial & listing details
- Price per square foot: $98/sqft
- Tax assessed value: $169,120
- Annual tax amount: $3,331
- Date on market: 10/13/2026
Estimated market value
Not available
Estimated sales range
Not available
$1,472/mo
Price history
| Date | Event | Price |
|---|---|---|
| 10/19/2026 | Price change | $169,900-2.9%$98/sqft |
Source: Owner Report a problem | ||
| 10/13/2026 | Listed for sale | $174,900+107.5%$101/sqft |
Source: Owner Report a problem | ||
| 5/22/2026 | Sold | $84,301-38.9%$49/sqft |
Source: Public Record Report a problem | ||
| 10/14/2022 | Sold | $138,000-1.4%$79/sqft |
Source:  Northeast Iowa Regional BOR as distributed by MLS GRID #20224283 Report a problem | ||
| 9/12/2022 | Pending sale | $140,000$81/sqft |
Source: Northeast Iowa Regional BOR as distributed by MLS GRID #20224283 Report a problem | ||
| 9/8/2022 | Listed for sale | $140,000+14.8%$81/sqft |
Source: Northeast Iowa Regional BOR as distributed by MLS GRID #20224283 Report a problem | ||
| 9/19/2016 | Sold | $122,000-2.4%$70/sqft |
Source: Northeast Iowa Regional BOR as distributed by MLS GRID #20161607 Report a problem | ||
| 6/10/2016 | Price change | $125,000-3.5%$72/sqft |
Source: RE/MAX HOME GROUP #20161607 Report a problem | ||
| 3/29/2016 | Listed for sale | $129,500$75/sqft |
Source: RE/MAX HOME GROUP #20161607 Report a problem | ||
Public tax history
| Year | Property taxes | Tax assessment |
|---|---|---|
| 2025 | $3,331 +8.5% | $169,120 +10.1% |
| 2024 | $3,069 +19% | $153,550 |
| 2023 | $2,580 +7.4% | $153,550 +21.5% |
| 2022 | $2,401 +2.4% | $126,330 +4.2% |
| 2021 | $2,346 +1.8% | $121,260 +8.1% |
| 2020 | $2,303 -1.1% | $112,160 |
| 2019 | $2,330 +1% | $112,160 |
| 2018 | $2,306 +0% | $112,160 |
| 2017 | $2,306 +5.4% | $112,160 +6.7% |
| 2016 | $2,188 | $105,150 |
| 2015 | $2,188 +6.2% | $105,150 +4.8% |
| 2014 | $2,060 -7.2% | $100,380 -4.5% |
| 2012 | $2,219 +7.9% | $105,150 |
| 2011 | $2,058 +3.3% | $105,150 +5.9% |
| 2010 | $1,992 +2.8% | $99,310 |
| 2009 | $1,938 +2.2% | $99,310 |
| 2008 | $1,897 +1.7% | $99,310 +7% |
| 2007 | $1,865 -0.5% | $92,810 |
| 2006 | $1,875 +9.5% | $92,810 |
| 2005 | $1,712 +5.8% | $92,810 +28.7% |
| 2003 | $1,618 +1.7% | $72,130 |
| 2002 | $1,591 +10.7% | $72,130 +18% |
| 2001 | $1,437 | $61,130 |
Find assessor info on the county website
Monthly payment
Est. payment
Payment breakdown
Explore the cost of this home by adjusting the details. Changes won't be saved.Climate risks
Neighborhood: Liberty Park


Similar homes
- $169,9003 bd2 ba1.8k sqft1517 Hammond Ave, Waterloo, IA 50702For Sale
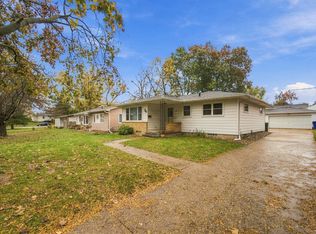 MLS ID #20265395, Stephanie D Ricketts, Structure Real Estate. Northeast Iowa Regional BOR as distributed by MLS GRID
- $169,9003 bd1 ba1.2k sqft813 Bourland Ave, Waterloo, IA 50702For Sale
 MLS ID #20265166, Christopher Fischels, Fischels Commercial Group. Northeast Iowa Regional BOR as distributed by MLS GRID
- $169,5003 bd1 ba1.7k sqft1520 E Mitchell Ave, Waterloo, IA 50702For Sale
 MLS ID #20264780, Elke M Gerdes, Structure Real Estate. Northeast Iowa Regional BOR as distributed by MLS GRID
- $174,9004 bd2 ba1.8k sqft1420 E Mitchell Ave, Waterloo, IA 50702For Sale
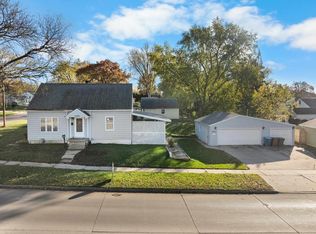 MLS ID #20264027, Jared Hottle, Berkshire Hathaway Home Serv. Northeast Iowa Regional BOR as distributed by MLS GRID
