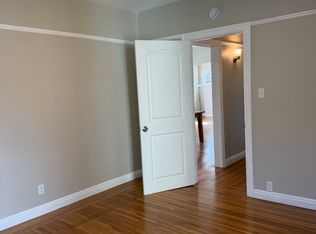
Rarely present in Albany. A lot of upgrades since last unsuccessful sale. Upper level was rented $3500. Street level unit was rented $3300. Nice investment deal. Or live one and rent another one.
For sale
Price cut: $37K (5/29)
$1,388,000
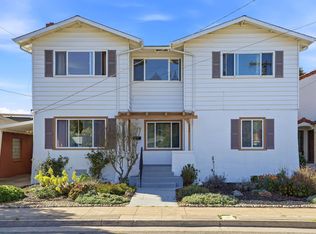
840 Key Route Blvd, Albany, CA 94706
5beds
2baths
1,978sqft
Duplex
Built in 1925
-- sqft lot
$1,354,000 Zestimate®
$702/sqft
$-- HOA
What's special
- 110 days |
- 780 |
- 28 |
Zillow last checked:
Listing updated:
Listed by:
Shelly Ouyang DRE #01914048 510-229-8166,
Shelly Ouyang, Broker
Source: bridgeMLS/CCAR/Bay East AOR,MLS#: 41127157
Loading...
Facts & features
Interior
Bedrooms & bathrooms
- Bedrooms: 5
- Bathrooms: 2
Heating
- Forced Air
Cooling
- No Air Conditioning
Appliances
- Included: Dryer, Washer, Gas Water Heater
Features
- Flooring: Wood
- Basement: None
Interior area
- Total structure area: 1,978
- Total interior livable area: 1,978 sqft
Property
Parking
- Parking features: Off Street, Parking Lot, RV/Boat Parking, Side Yard Access
Features
- Exterior features: Back Yard
- Fencing: Fenced
Lot
- Size: 3,920 Square Feet
- Features: Level
Details
- Parcel number: 67283323
- Special conditions: Standard
Construction
Type & style
- Home type: MultiFamily
- Property subtype: Duplex
Materials
- Stucco
Condition
- Year built: 1925
Utilities & green energy
- Sewer: Public Sewer
- Water: Public
Community & HOA
HOA
- Has HOA: No
Location
- Region: Albany
Financial & listing details
- Price per square foot: $702/sqft
- Tax assessed value: $1,316,105
- Date on market: 3/13/2026
- Listing terms: Cash,1031 Exchange
Estimated market value
$1,354,000
$1.29M - $1.42M
$4,248/mo
Price history
| Date | Event | Price |
|---|---|---|
| 5/29/2026 | Price change | $1,388,000-2.6%$702/sqft |
Source: | ||
| 5/20/2026 | Price change | $1,425,000-1.6%$720/sqft |
Source: | ||
| 5/8/2026 | Price change | $1,448,000-0.1%$732/sqft |
Source: | ||
| 3/30/2026 | Price change | $1,449,000-2.1%$733/sqft |
Source: | ||
| 3/5/2026 | Listed for sale | $1,480,000+10.6%$748/sqft |
Source: | ||
| 1/9/2026 | Listing removed | $1,338,000$676/sqft |
Source: | ||
| 10/13/2025 | Price change | $1,338,000-3%$676/sqft |
Source: | ||
| 8/8/2025 | Listed for sale | $1,380,000+9.1%$698/sqft |
Source: | ||
| 11/26/2024 | Listing removed | $3,400$2/sqft |
Source: Zillow Rentals Report a problem | ||
| 11/3/2024 | Listed for rent | $3,400-2.9%$2/sqft |
Source: Zillow Rentals Report a problem | ||
| 3/30/2023 | Sold | $1,265,000+1.2%$640/sqft |
Source: | ||
| 3/9/2023 | Pending sale | $1,250,000$632/sqft |
Source: | ||
| 3/1/2023 | Price change | $1,250,000-3.1%$632/sqft |
Source: | ||
| 1/13/2023 | Listed for sale | $1,290,000+33.4%$652/sqft |
Source: | ||
| 12/13/2022 | Listing removed | -- |
Source: Zillow Rentals Report a problem | ||
| 12/11/2022 | Price change | $3,500-16.7%$2/sqft |
Source: Zillow Rentals Report a problem | ||
| 11/29/2022 | Listed for rent | $4,200+23.5%$2/sqft |
Source: Zillow Rental Manager Report a problem | ||
| 5/6/2021 | Listing removed | -- |
Source: Zillow Rental Manager Report a problem | ||
| 4/6/2021 | Listed for rent | $3,400-2.6%$2/sqft |
Source: Zillow Rental Manager Report a problem | ||
| 3/24/2021 | Listing removed | -- |
Source: Owner Report a problem | ||
| 2/8/2020 | Listing removed | $3,490$2/sqft |
Source: Owner Report a problem | ||
| 1/8/2020 | Listed for rent | $3,490$2/sqft |
Source: Owner Report a problem | ||
| 7/19/2016 | Sold | $967,000+4.5%$489/sqft |
Source: | ||
| 5/31/2016 | Pending sale | $925,000$468/sqft |
Source: Red Oak Realty #40739709 Report a problem | ||
| 5/10/2016 | Listed for sale | $925,000$468/sqft |
Source: Red Oak Realty #40739709 Report a problem | ||
Public tax history
| Year | Property taxes | Tax assessment |
|---|---|---|
| 2025 | -- | $1,316,105 +2% |
| 2024 | $22,561 +17.5% | $1,290,300 +19.6% |
| 2023 | $19,193 +2.8% | $1,078,687 +2% |
| 2022 | $18,671 +1.4% | $1,057,540 +2% |
| 2021 | $18,412 +0.9% | $1,036,807 +1% |
| 2020 | $18,256 +2.3% | $1,026,180 +2% |
| 2019 | $17,842 +5.5% | $1,006,066 +2% |
| 2018 | $16,917 | $986,340 +2% |
| 2017 | $16,917 +400.7% | $967,000 +870.8% |
| 2016 | $3,378 +41.3% | $99,609 +1.5% |
| 2015 | $2,391 +0.2% | $98,113 +2% |
| 2014 | $2,385 | $96,191 +0.5% |
| 2013 | -- | $95,757 +2% |
| 2012 | -- | $93,880 +2% |
| 2011 | -- | $92,039 +0.8% |
| 2010 | -- | $91,351 -0.2% |
| 2009 | -- | $91,569 +2% |
| 2008 | -- | $89,773 +2% |
| 2007 | -- | $88,013 +2% |
| 2006 | -- | $86,287 +2% |
| 2005 | -- | $84,596 +2% |
| 2004 | -- | $82,938 +1.9% |
| 2003 | -- | $81,419 +2% |
| 2002 | -- | $79,823 +2% |
| 2001 | $1,616 | $78,257 |
Find assessor info on the county website
Monthly payment
Est. payment$--/mo
Payment breakdown
Explore the cost of this home by adjusting the details. Changes won't be saved.All calculations are estimates and provided by Zillow, Inc. for informational purposes only. Actual amounts may vary.
HOA fees may include property taxes on listings classified as Co-Ops. Contact the listing agent and/or owner for fee details.
Mortgage interest rates are dependent on a number of factors, including credit score, down payment, and repayment length. Interest rate data provided by Zillow Group Marketplace, Inc. as of 1/1/1970 from various mortgage lenders with which we have lead or other similar arrangements; the Estimated Payment is an average of those rates.
See how much you could borrow to make a competitive offer.
Climate risks
Neighborhood: San Gabriel Triangle
Nearby schools
GreatSchools rating
- 9/10Cornell Elementary SchoolGrades: K-5Distance: 0.2 mi
- 10/10Albany Middle SchoolGrades: 6-8Distance: 0.5 mi
- 10/10Albany High SchoolGrades: 9-12Distance: 0.3 mi
A local agent can set up tours, give advice and negotiate with sellers.


Local buyer's agents are ready to help
- California
- Alameda County
- Albany
- 94706
- San Gabriel Triangle
- 840 Key Route Blvd
Nearby cities
Nearby neighborhoods
Nearby zip codes
Other Albany Topics
