$177,000
5 bd|2 ba|1.3k sqft
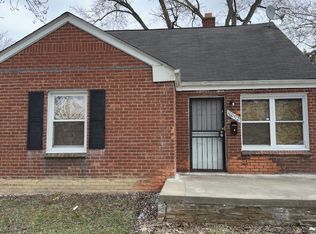
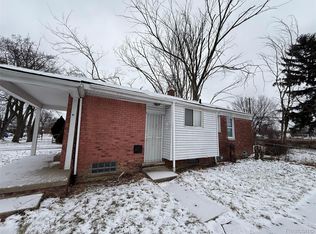
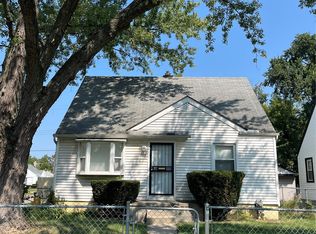
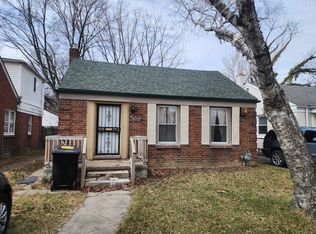
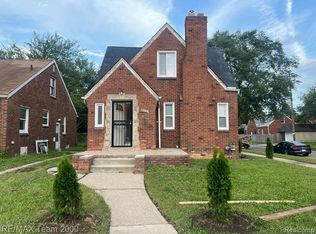
8500 Lauder St, Detroit, MI 48228
Sold
Zillow last checked:
Listing updated:
Nadia Kassim 586-668-3106,
Network Realty LLC 313-384-0191
$78,100
$73,000 - $82,000
$1,358/mo
| Date | Event | Price |
|---|---|---|
| 5/26/2026 | Listed for sale | $84,999$93/sqft |
Source: | ||
| 5/1/2026 | Listing removed | $84,999$93/sqft |
Source: | ||
| 4/29/2026 | Price change | $84,999+13.3%$93/sqft |
Source: | ||
| 4/22/2026 | Price change | $74,999+7.1%$82/sqft |
Source: | ||
| 4/20/2026 | Price change | $69,999-6.7%$77/sqft |
Source: | ||
| 3/30/2026 | Price change | $74,999-6.3%$82/sqft |
Source: | ||
| 3/10/2026 | Price change | $79,999-5.9%$88/sqft |
Source: | ||
| 3/3/2026 | Price change | $84,999-14.1%$93/sqft |
Source: | ||
| 2/16/2026 | Listed for sale | $99,000+52.3%$108/sqft |
Source: | ||
| 4/10/2025 | Listing removed | $64,999-13.3%$71/sqft |
Source: | ||
| 8/1/2024 | Listing removed | -- |
Source: | ||
| 2/8/2024 | Listed for sale | $74,999+15.4%$82/sqft |
Source: | ||
| 1/3/2024 | Listing removed | -- |
Source: | ||
| 10/13/2023 | Listed for sale | $64,999+1.6%$71/sqft |
Source: | ||
| 9/1/2023 | Listing removed | -- |
Source: | ||
| 5/5/2023 | Price change | $63,999-1.5%$70/sqft |
Source: | ||
| 4/13/2023 | Price change | $64,999-4.4%$71/sqft |
Source: | ||
| 4/6/2023 | Listed for sale | $67,999+23.6%$74/sqft |
Source: | ||
| 6/17/2022 | Sold | $55,000-7.9%$60/sqft |
Source: | ||
| 6/11/2022 | Pending sale | $59,750$65/sqft |
Source: | ||
| 5/20/2022 | Listed for sale | $59,750$65/sqft |
Source: | ||
| 3/1/2022 | Listing removed | -- |
Source: | ||
| 2/1/2022 | Listed for sale | $59,750$65/sqft |
Source: | ||
| 1/12/2022 | Pending sale | $59,750$65/sqft |
Source: | ||
| 1/5/2022 | Listed for sale | $59,750+70.7%$65/sqft |
Source: | ||
| 12/1/2021 | Listing removed | -- |
Source: | ||
| 9/13/2021 | Sold | $35,000$38/sqft |
Source: Public Record Report a problem | ||
| Year | Property taxes | Tax assessment |
|---|---|---|
| 2025 | -- | $31,300 +21.3% |
| 2024 | -- | $25,800 +25.9% |
| 2023 | -- | $20,500 +19.2% |
| 2022 | -- | $17,200 +9.6% |
| 2021 | -- | $15,700 |
| 2020 | $1,145 +5.3% | $15,700 +24.6% |
| 2019 | $1,088 | $12,600 +16.7% |
| 2018 | $1,088 | $10,800 +12.5% |
| 2017 | -- | $9,600 -28.4% |
| 2016 | $1,994 | $13,400 |
| 2015 | $1,994 +5.6% | $13,400 -29% |
| 2013 | $1,888 -5.3% | $18,884 -30.2% |
| 2010 | $1,994 | $27,058 -12% |
| 2009 | -- | $30,748 -13.5% |
| 2008 | -- | $35,547 |
| 2007 | -- | $35,547 +5.5% |
| 2005 | $238 | $33,694 +3% |
| 2004 | -- | $32,713 |
Find assessor info on the county website
A local agent can set up tours, give advice and negotiate with sellers.