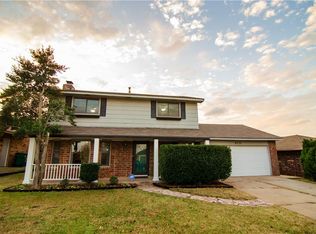
This 1650 square foot single family home has 3 bedrooms and 2.0 bathrooms. This home is located at 8729 Cindy Rd, Oklahoma City, OK 73132.
Pre-foreclosure
Street View
Est. $203,600
8729 Cindy Rd, Oklahoma City, OK 73132
3beds
2baths
1,650sqft
SingleFamily
Built in 1980
6,926 Square Feet Lot
$203,600 Zestimate®
$123/sqft
$-- HOA
Overview
- 275 days |
- 11 |
- 0 |
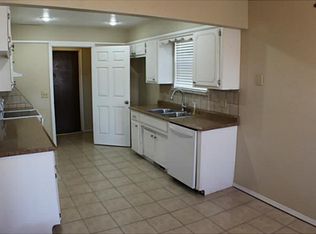
Facts & features
Interior
Bedrooms & bathrooms
- Bedrooms: 3
- Bathrooms: 2
Heating
- Other
Cooling
- Central
Features
- Has fireplace: Yes
Interior area
- Total interior livable area: 1,650 sqft
Property
Parking
- Parking features: Garage - Attached
Features
- Exterior features: Stone
Lot
- Size: 6,926 Square Feet
Details
- Parcel number: 3924149417760
Construction
Type & style
- Home type: SingleFamily
Materials
- Frame
- Foundation: Slab
- Roof: Composition
Condition
- Year built: 1980
Community & HOA
Location
- Region: Oklahoma City
Financial & listing details
- Price per square foot: $123/sqft
- Tax assessed value: $152,500
- Annual tax amount: $1,943
Visit our professional directory to find a foreclosure specialist in your area that can help with your home search.
Find a foreclosure agentForeclosure details
Estimated market value
$203,600
$185,000 - $220,000
$1,631/mo
Price history
| Date | Event | Price |
|---|---|---|
| 9/8/1989 | Sold | $52,500$32/sqft |
Source: Agent Provided Report a problem | ||
Public tax history
| Year | Property taxes | Tax assessment |
|---|---|---|
| 2025 | $1,943 +3.9% | $16,774 +3% |
| 2024 | $1,869 +3.5% | $16,286 +3% |
| 2023 | $1,806 +2% | $15,811 +3% |
| 2022 | $1,771 +4.2% | $15,351 +3% |
| 2021 | $1,699 +3.7% | $14,904 +3% |
| 2020 | $1,639 +33.9% | $14,470 +3% |
| 2019 | $1,224 +3.2% | $14,049 +3% |
| 2018 | $1,186 -21.3% | $13,640 +0.8% |
| 2017 | $1,507 | $13,529 +2.9% |
| 2016 | $1,507 +3.4% | $13,144 +2.5% |
| 2015 | $1,458 +7.4% | $12,825 +1.6% |
| 2014 | $1,358 | $12,619 +0.5% |
| 2013 | -- | $12,557 +0.1% |
| 2012 | -- | $12,549 -1.4% |
| 2011 | -- | $12,730 -1.4% |
| 2010 | -- | $12,908 +1.9% |
| 2009 | -- | $12,669 +5% |
| 2008 | -- | $12,065 +5% |
| 2007 | -- | $11,491 +5% |
| 2006 | -- | $10,944 +5% |
| 2005 | -- | $10,423 -88.5% |
| 2004 | $974 | $90,251 +809.1% |
| 2003 | -- | $9,927 +8.9% |
| 2002 | -- | $9,112 |
| 2001 | -- | $9,112 |
| 2000 | -- | $9,112 +7.5% |
| 1999 | -- | $8,480 |
Find assessor info on the county website
Monthly payment
Estimated monthly payment$1,822
All calculations are estimates and provided by Zillow, Inc. for informational purposes only. Actual amounts may vary.
HOA fees may include property taxes on listings classified as Co-Ops. Contact the listing agent and/or owner for fee details.
Mortgage interest rates are dependent on a number of factors, including credit score, down payment, and repayment length. Interest rate data provided by Zillow Group Marketplace, Inc. as of 1/1/1970 from various mortgage lenders with which we have lead or other similar arrangements; the Estimated Payment is an average of those rates.
See how much you could borrow to make a competitive offer.
Climate risks
Neighborhood: Rambling Acres
Nearby schools
GreatSchools rating
- 5/10Northridge Elementary SchoolGrades: PK-5Distance: 0.4 mi
- 5/10Cooper Middle SchoolGrades: 6-8Distance: 1.5 mi
- 3/10Putnam City High SchoolGrades: 9-12Distance: 4.6 mi


Nearby cities
Nearby neighborhoods
Nearby zip codes
Other Oklahoma City Topics
