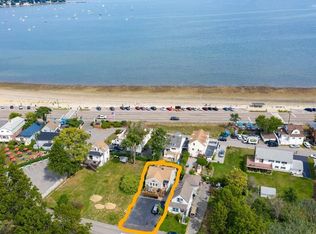
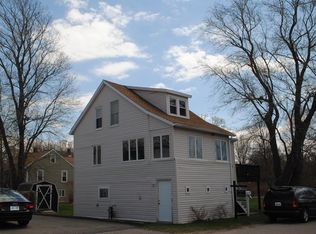
HUGE PRICE DROP! GORGEOUS WATER AND BOSTON SKYLINE VIEWS! Beautifully located property just steps from Wollaston Beach. This lovely 3-bedroom single-family home offers the perfect blend of coastal living and modern comfort, featuring a spacious living room ideal for relaxation and entertaining. The large kitchen is the heart of the home, offering abundant cabinetry, stainless steel appliances, a spacious island, and white tile flooring, along with an open kitchen and dining layout with gas cooking and direct access to the back deck—perfect for outdoor dining. Front decks and sun-filled front rooms showcase large windows with breathtaking views of Wollaston Bay, the beach, the ocean, and the distant Boston skyline. Hardwood floors, exposed beam ceilings, and oversized windows create a bright and airy atmosphere throughout. Nicely sized enclosed backyard with a private shed, and a walk-out basement.Covered parking. Your search for a single-family home with breathtaking views stops here!
For sale
$649,900
9 Chick St, Quincy, MA 02170
3beds
1,400sqft
Single Family Residence
Built in 1925
3,500 Square Feet Lot
$659,500 Zestimate®
$464/sqft
$-- HOA
What's special
Front decksPrivate shedNicely sized enclosed backyardExposed beam ceilingsHardwood floorsWalk-out basementSun-filled front rooms
- 5 days |
- 1,133 |
- 44 |
Zillow last checked:
Listing updated:
Listed by:
Derek Wong 617-290-8289,
V & E Realty 617-786-9399
Source: MLS PIN,MLS#: 73542617
Loading...
Facts & features
Interior
Bedrooms & bathrooms
- Bedrooms: 3
- Bathrooms: 2
- Full bathrooms: 2
Primary bedroom
- Level: Second
Bedroom 2
- Level: Second
Bedroom 3
- Level: Second
Dining room
- Level: First
Kitchen
- Level: First
Living room
- Level: First
Heating
- Steam
Cooling
- Other
Appliances
- Included: Range, Dishwasher, Refrigerator
Features
- Flooring: Wood, Tile
- Basement: Full,Partially Finished
- Has fireplace: No
Interior area
- Total structure area: 1,400
- Total interior livable area: 1,400 sqft
- Finished area above ground: 1,400
Property
Parking
- Total spaces: 2
- Parking features: Paved Drive
- Uncovered spaces: 2
Features
- Patio & porch: Deck, Deck - Wood, Deck - Vinyl
- Exterior features: Deck, Deck - Wood, Deck - Vinyl
- Has view: Yes
- View description: Scenic View(s), Water, Bay
- Has water view: Yes
- Water view: Bay,Water
- Waterfront features: Waterfront, Ocean, Bay, Bay, 0 to 1/10 Mile To Beach
Lot
- Size: 3,500 Square Feet
Details
- Parcel number: M:5066 B:17 L:25,186933
- Zoning: RESA
Construction
Type & style
- Home type: SingleFamily
- Architectural style: Cape
- Property subtype: Single Family Residence
Materials
- Frame
- Foundation: Other
Condition
- Year built: 1925
Utilities & green energy
- Sewer: Public Sewer
- Water: Public
- Utilities for property: for Gas Range
Community & HOA
HOA
- Has HOA: No
Location
- Region: Quincy
Financial & listing details
- Price per square foot: $464/sqft
- Tax assessed value: $686,400
- Annual tax amount: $7,914
- Date on market: 6/27/2026
Estimated market value
$659,500
$627,000 - $692,000
$3,498/mo
Price history
| Date | Event | Price |
|---|---|---|
| 6/27/2026 | Listed for sale | $649,900-7%$464/sqft |
Source: MLS PIN #73542617 Report a problem | ||
| 6/26/2026 | Listing removed | $699,000$499/sqft |
Source: MLS PIN #73484969 Report a problem | ||
| 5/2/2026 | Price change | $699,000-10.3%$499/sqft |
Source: MLS PIN #73484969 Report a problem | ||
| 3/30/2026 | Price change | $779,000-6.1%$556/sqft |
Source: MLS PIN #73484969 Report a problem | ||
| 3/11/2026 | Listed for sale | $829,900+100.2%$593/sqft |
Source: MLS PIN #73484969 Report a problem | ||
| 7/10/2023 | Listing removed | -- |
Source: Zillow Rentals Report a problem | ||
| 7/1/2023 | Price change | $3,600-5.3%$3/sqft |
Source: Zillow Rentals Report a problem | ||
| 6/26/2023 | Price change | $3,800-9.5%$3/sqft |
Source: Zillow Rentals Report a problem | ||
| 6/24/2023 | Listed for rent | $4,200$3/sqft |
Source: Zillow Rentals Report a problem | ||
| 9/9/2019 | Sold | $414,500-2.5%$296/sqft |
Source: Public Record Report a problem | ||
| 7/8/2019 | Pending sale | $425,000$304/sqft |
Source: Flavin & Flavin Realty, Inc. #72508243 Report a problem | ||
| 6/18/2019 | Price change | $425,000-6.6%$304/sqft |
Source: Flavin & Flavin Realty, Inc. #72508243 Report a problem | ||
| 6/11/2019 | Price change | $454,900-2.2%$325/sqft |
Source: Flavin & Flavin Realty, Inc. #72508243 Report a problem | ||
| 6/4/2019 | Price change | $464,900-4.1%$332/sqft |
Source: Flavin & Flavin Realty, Inc. #72508243 Report a problem | ||
| 4/19/2019 | Pending sale | $484,900$346/sqft |
Source: Flavin & Flavin Realty, Inc. #72475741 Report a problem | ||
| 4/11/2019 | Price change | $484,900-7.6%$346/sqft |
Source: Flavin & Flavin Realty, Inc. #72475741 Report a problem | ||
| 4/3/2019 | Listed for sale | $525,000$375/sqft |
Source: Flavin & Flavin Realty, Inc. #72475741 Report a problem | ||
Public tax history
| Year | Property taxes | Tax assessment |
|---|---|---|
| 2025 | $7,914 +2.8% | $686,400 +0.5% |
| 2024 | $7,700 +7.4% | $683,200 +6.1% |
| 2023 | $7,168 +1.9% | $644,000 +9.7% |
| 2022 | $7,031 +4% | $586,900 +5.4% |
| 2021 | $6,760 +0.4% | $556,800 +2.8% |
| 2020 | $6,732 +7% | $541,600 +8% |
| 2019 | $6,293 -1.4% | $501,400 +4.8% |
| 2018 | $6,385 +5.4% | $478,600 +11.9% |
| 2017 | $6,059 +4.2% | $427,600 +5.6% |
| 2016 | $5,816 +10.2% | $405,000 +12% |
| 2015 | $5,279 +7.4% | $361,600 +9.3% |
| 2014 | $4,916 -0.5% | $330,800 -2.9% |
| 2013 | $4,940 +5.4% | $340,700 |
| 2012 | $4,685 +7.9% | $340,700 +5.3% |
| 2011 | $4,341 -2.9% | $323,500 -4.4% |
| 2010 | $4,472 +3.7% | $338,300 -1.2% |
| 2009 | $4,314 +13.2% | $342,400 -2.7% |
| 2008 | $3,810 +5.4% | $351,800 +1.6% |
| 2007 | $3,615 -1.6% | $346,300 -2.6% |
| 2006 | $3,672 +0.3% | $355,500 +5.3% |
| 2005 | $3,661 -5.8% | $337,700 +9.1% |
| 2004 | $3,886 +61.4% | $309,400 +75.1% |
| 2003 | $2,407 +19.5% | $176,700 +39.8% |
| 2001 | $2,015 +4.6% | $126,400 |
| 1999 | $1,926 | $126,400 |
Find assessor info on the county website
Monthly payment
Est. payment$--/mo
Payment breakdown
Explore the cost of this home by adjusting the details. Changes won't be saved.All calculations are estimates and provided by Zillow, Inc. for informational purposes only. Actual amounts may vary.
HOA fees may include property taxes on listings classified as Co-Ops. Contact the listing agent and/or owner for fee details.
Mortgage interest rates are dependent on a number of factors, including credit score, down payment, and repayment length. Interest rate data provided by Zillow Group Marketplace, Inc. as of 1/1/1970 from various mortgage lenders with which we have lead or other similar arrangements; the Estimated Payment is an average of those rates.
See how much you could borrow to make a competitive offer.
Climate risks
Neighborhood: North Quincy
Nearby schools
GreatSchools rating
- 8/10Beechwood Knoll Elementary SchoolGrades: K-5Distance: 0.4 mi
- 8/10Central Middle SchoolGrades: 6-8Distance: 1 mi
- 8/10North Quincy High SchoolGrades: 9-12Distance: 1.2 mi
A local agent can set up tours, give advice and negotiate with sellers.


Nearby cities
Nearby neighborhoods
Nearby zip codes
Other Quincy Topics
