Turnkey, cash-flowing 6-bedroom, 2-bath single-family investment property featuring stable long-term Section 8 CMHA tenants paying $1,400/month with a proven 2+ year rental history. This converted 2-family home offers 1,500 sq. ft. of space, an eat-in kitchen, separate living and dining rooms, a basement with washer/dryer hookups, a 2-car garage space, yard, and front porch. Extremely low landlord overhead with tenants covering trash, gas, and electric. Priced to sell quickly for a direct, hassle-free transaction—no agents or wholesalers, please.
For sale by owner
$89,900
901 Rudyard Rd, Cleveland, OH 44110
7beds
2baths
1,500sqft
SingleFamily
Built in 1920
3,502 Square Feet Lot
$99,200 Zestimate®
$60/sqft
$-- HOA
What's special
Front porchEat-in kitchen
- 9 hours
- 93
- 7
Listed by:
Property Owner (954) 871-7678
Facts & features
Interior
Bedrooms & bathrooms
- Bedrooms: 7
- Bathrooms: 2
Heating
- Forced air, Gas
Cooling
- None
Appliances
- Included: Dryer, Washer
- Laundry: In Unit
Features
- Flooring: Hardwood
- Basement: Partially finished
Interior area
- Total interior livable area: 1,500 sqft
Property
Parking
- Total spaces: 2
- Parking features: None, Garage
Features
- Exterior features: Other
Lot
- Size: 3,502 Square Feet
Details
- Parcel number: 11527080
Construction
Type & style
- Home type: SingleFamily
- Architectural style: Colonial
Materials
- Roof: Asphalt
Condition
- New construction: No
- Year built: 1920
Community & HOA
Location
- Region: Cleveland
Financial & listing details
- Price per square foot: $60/sqft
- Tax assessed value: $66,900
- Annual tax amount: $1,567
- Date on market: 11/1/2026
Estimated market value
$99,200
$76,000 - $124,000
$1,522/mo
Price history
| Date | Event | Price |
|---|---|---|
| 11/1/2026 | Listed for sale | $89,900+36.2%$60/sqft |
Source: Owner Report a problem | ||
| 2/4/2025 | Listing removed | $1,645$1/sqft |
Source: Zillow Rentals Report a problem | ||
| 1/22/2025 | Listed for rent | $1,645-1.8%$1/sqft |
Source: Zillow Rentals Report a problem | ||
| 11/1/2024 | Listing removed | $1,675$1/sqft |
Source: Zillow Rentals Report a problem | ||
| 10/21/2024 | Price change | $1,675-4%$1/sqft |
Source: Zillow Rentals Report a problem | ||
| 10/9/2024 | Price change | $1,745-2.2%$1/sqft |
Source: Zillow Rentals Report a problem | ||
| 9/18/2024 | Listed for rent | $1,785+49.4%$1/sqft |
Source: Zillow Rentals Report a problem | ||
| 2/8/2022 | Listing removed | -- |
Source: Zillow Rental Manager Report a problem | ||
| 2/3/2022 | Price change | $1,195-20.3%$1/sqft |
Source: Zillow Rental Manager Report a problem | ||
| 12/10/2021 | Price change | $1,500+50.8%$1/sqft |
Source:  RE/MAX International #4336635 Report a problem | ||
| 12/3/2021 | Listed for rent | $995$1/sqft |
Source: RE/MAX International #4336635 Report a problem | ||
| 9/10/2021 | Sold | $66,000+65%$44/sqft |
Source: Public Record Report a problem | ||
| 3/8/2018 | Sold | $40,000+14.3%$27/sqft |
Source: Public Record Report a problem | ||
| 10/17/2017 | Sold | $35,000-10.3%$23/sqft |
Source: Public Record Report a problem | ||
| 12/17/2015 | Sold | $39,000+227.7%$26/sqft |
Source: Public Record Report a problem | ||
| 10/26/2015 | Sold | $11,900-4.8%$8/sqft |
Source:  MLS Now #3743212 Report a problem | ||
| 9/24/2015 | Pending sale | $12,500$8/sqft |
Source: Sarver Realty #3743212 Report a problem | ||
| 8/30/2015 | Listed for sale | $12,500-81.7%$8/sqft |
Source: Sarver Realty #3743212 Report a problem | ||
| 8/11/2015 | Sold | $68,288+104.9%$46/sqft |
Source: Public Record Report a problem | ||
| 5/3/2004 | Sold | $33,334-55.6%$22/sqft |
Source: Public Record Report a problem | ||
| 1/23/2001 | Sold | $75,000$50/sqft |
Source: Public Record Report a problem | ||
Public tax history
| Year | Property taxes | Tax assessment |
|---|---|---|
| 2025 | $1,567 +0% | $23,420 |
| 2024 | $1,566 +44.3% | $23,420 +67.3% |
| 2023 | $1,085 +0.6% | $14,000 |
| 2022 | $1,079 +0.9% | $14,000 |
| 2021 | $1,069 +11.4% | $14,000 +29% |
| 2020 | $959 +8% | $10,850 |
| 2019 | $888 +0.3% | $10,850 |
| 2018 | $886 +13.7% | $10,850 +17.8% |
| 2017 | $779 +0.8% | $9,210 |
| 2016 | $772 | $9,210 |
| 2015 | $772 -13.3% | $9,210 -12.9% |
| 2014 | $891 +1.7% | $10,580 |
| 2013 | $876 +2.9% | $10,580 |
| 2012 | $852 +6% | $10,580 -18.6% |
| 2011 | $803 -47% | $12,990 -47.1% |
| 2010 | $1,515 +0.8% | $24,540 |
| 2009 | $1,503 -7.6% | $24,540 -12% |
| 2008 | $1,626 +3.3% | $27,900 |
| 2007 | $1,574 +0.1% | $27,900 |
| 2006 | $1,572 -29.4% | $27,900 +6.2% |
| 2005 | $2,228 +44.8% | $26,260 |
| 2004 | $1,539 +1.1% | $26,260 |
| 2003 | $1,522 +57.8% | $26,260 +56.3% |
| 2002 | $965 -41.2% | $16,800 |
| 2001 | $1,641 +4.5% | $16,800 |
| 2000 | $1,571 | $16,800 |
Find assessor info on the county website
Monthly payment
Est. payment
Payment breakdown
Explore the cost of this home by adjusting the details. Changes won't be saved.Climate risks
Neighborhood: South Collinwood


Similar homes
- $93,0005 bd2 ba1.1k sqft14808 Pepper Ave, Cleveland, OH 44110For Sale
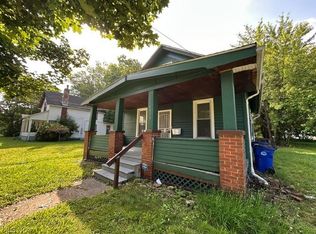 MLS ID #5257053, Jad Sandi, LPT Realty. MLS Now
- $90,0004 bd3 ba1.5k sqft1430 Larchmont Rd, Cleveland, OH 44110For Sale
 MLS ID #5254123, Joseph M Ciani, HomeSmart Real Estate Momentum LLC. MLS Now
- $--4 bd1 ba1.1k sqft981 Stevenson Rd, Cleveland, OH 44110Auction
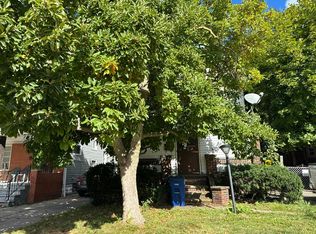 Auction.com 2
- $85,0005 bd3 ba1.8k sqft806 E 157th St, Cleveland, OH 44110For Sale
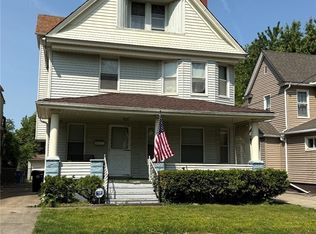 MLS ID #5227916, Maria T Ferris, MarDom Real Estate. MLS Now
