This 1716 square foot single family home has 4 bedrooms and 2.0 bathrooms. This home is located at 9033 SW 5th St, Boca Raton, FL 33433.
Pre-foreclosure
Street View
Est. $515,100
9033 SW 5th St, Boca Raton, FL 33433
4beds
2baths
1,716sqft
SingleFamily
Built in 1975
7,187 Square Feet Lot
$515,100 Zestimate®
$300/sqft
$-- HOA
Overview
- 50 days
- 687
- 29
Facts & features
Interior
Bedrooms & bathrooms
- Bedrooms: 4
- Bathrooms: 2
Heating
- Forced air
Cooling
- Central
Features
- Flooring: Other, Carpet
Interior area
- Total interior livable area: 1,716 sqft
Property
Parking
- Parking features: Garage
Features
- Exterior features: Stucco
Lot
- Size: 7,187 Square Feet
Details
- Parcel number: 00424729030300020
Construction
Type & style
- Home type: SingleFamily
Materials
- masonry
- Roof: Asphalt
Condition
- Year built: 1975
Community & HOA
Location
- Region: Boca Raton
Financial & listing details
- Price per square foot: $300/sqft
- Tax assessed value: $427,500
- Annual tax amount: $2,359
Foreclosure details
Estimated market value
$515,100
$474,000 - $556,000
$3,956/mo
Price history
| Date | Event | Price |
|---|---|---|
| 1/28/2005 | Sold | $225,000+89.9%$131/sqft |
Source: Public Record Report a problem | ||
| 1/14/2000 | Sold | $118,500$69/sqft |
Source: Public Record Report a problem | ||
Public tax history
| Year | Property taxes | Tax assessment |
|---|---|---|
| 2025 | $2,359 +3.5% | $157,414 +2.9% |
| 2024 | $2,280 +3.2% | $152,978 +3% |
| 2023 | $2,210 +1.6% | $148,522 +3% |
| 2022 | $2,176 +1.8% | $144,196 +3% |
| 2021 | $2,137 +1.2% | $139,996 +1.4% |
| 2020 | $2,112 +1.5% | $138,063 +2.3% |
| 2019 | $2,082 | $134,959 +1.9% |
| 2018 | $2,082 +5.3% | $132,443 +2.1% |
| 2017 | $1,977 +2.5% | $129,719 +2.1% |
| 2016 | $1,928 +0.3% | $127,051 +0.7% |
| 2015 | $1,923 -2.1% | $126,168 +0.8% |
| 2014 | $1,964 +1.9% | $125,167 +1.5% |
| 2013 | $1,928 -0.2% | $123,317 +1.7% |
| 2012 | $1,932 -6.1% | $121,256 -3.7% |
| 2011 | $2,056 +0.1% | $125,880 +1.5% |
| 2010 | $2,054 -17.1% | $124,020 -17.8% |
| 2009 | $2,479 -27.8% | $150,959 -32% |
| 2008 | $3,431 -16.8% | $222,103 -12.4% |
| 2007 | $4,123 -18.6% | $253,536 -2.3% |
| 2006 | $5,064 | $259,460 +127.7% |
| 2005 | -- | $113,946 +3% |
| 2004 | $888 +259.6% | $110,627 +1.9% |
| 2003 | $247 -86.4% | $108,564 +2.4% |
| 2002 | $1,817 +0.8% | $106,020 +1.6% |
| 2001 | $1,802 -12.3% | $104,350 +11.7% |
| 2000 | $2,054 +13.1% | $93,392 +0.3% |
| 1999 | $1,817 | $93,109 |
Find assessor info on the county website
Monthly payment
Climate risks
Neighborhood: Sandalfoot Cove

Similar homes
- $599,9003 bd2 ba1.8k sqft22977 SW 56TH Avenue, Boca Raton, FL 33433For Sale
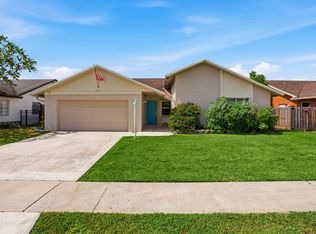
 MLS ID #B26087312, Amanda Clark, William Raveis Real Estate. BeachesMLS
- $558,0003 bd2 ba1.4k sqft23089 SW 55th Avenue, Boca Raton, FL 33433For Sale
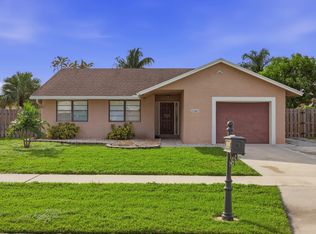 MLS ID #B26096353, Diane Umbarila, EXP Realty. BeachesMLS
- $645,0004 bd3 ba1.7k sqft8611 OLD TOWNE Way, Boca Raton, FL 33433For Sale
 MLS ID #B26095719, Dennys Aulicino, Balistreri Real Estate Inc. BeachesMLS
- $490,0003 bd2 ba1.1k sqft8315 GARDEN GATE Place, Boca Raton, FL 33433For Sale
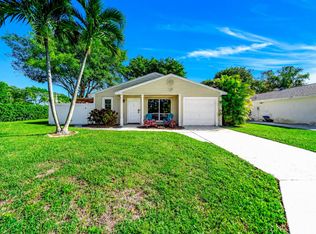 MLS ID #B26085018, Erica L Shepherd, KW Innovations. BeachesMLS
- $589,0003 bd2 ba1.8k sqft22875 BARRISTER Drive, Boca Raton, FL 33433For SaleMLS ID #B26086691, Sergio Bonadona, Fathom Realty FL, LLC. BeachesMLS
- $520,0003 bd2 ba1.5k sqft9665 SW 1ST Place, Boca Raton, FL 33428For SaleMLS ID #B26090877, Melissa Maria Nichols, Florida Prestigious Homes Inc. BeachesMLS
- $449,0003 bd2 ba1.3k sqft22209 SW 64TH Way, Boca Raton, FL 33428For SaleMLS ID #B26098522, Emilly Montes, Keller Williams Realty Service. BeachesMLS
- $690,0004 bd3 ba1.9k sqft8783 SW 16TH Street, Boca Raton, FL 33433For SaleMLS ID #B26097488, Chelsea Loiseau, Compass Florida LLC. BeachesMLS
- $548,9003 bd2 ba1.4k sqft22750 SW 65TH Terrace, Boca Raton, FL 33428For SaleMLS ID #B26096204, Ademir Aparecido Correa Junior, Max C&T Realty LLC. BeachesMLS
- $664,0004 bd2 ba2k sqft8843 SW 16th Street, Boca Raton, FL 33433For SaleMLS ID #B26049305, Adelisa M Salvatori, Home Hunters Real Estate. BeachesMLS
- $580,0003 bd3 ba1.9k sqft21195 JUEGO Circle #16-A, Boca Raton, FL 33433For SaleMLS ID #B26061899, Carlos Marcelo Gil, Parrot Realty LLC. BeachesMLS
- $574,9002 bd2 ba1.3k sqft7967 Little Lane, Boca Raton, FL 33433For SaleMLS ID #B26060650, Stephen A Mossini, Local Real Estate Co. BeachesMLS
- $690,0003 bd2 ba1.8k sqft22899 Royal Crown Terrace, Boca Raton, FL 33433For SaleMLS ID #B26080617, Lesley Ann Henrici, Keyes Company. BeachesMLS
- $560,0002 bd2 ba1.3k sqftSandalfoot Cove Sec 3, Boca Raton, FL 33428For Sale
 MLS ID #A12065304, Renata Reis Rodrigues, United Realty Group Inc.. MIAMI
- $549,0003 bd2 ba2.1k sqft8008 Eastlake Drive, Boca Raton, FL 33433For SaleMLS ID #B26052045, Yveline B Andrieu, Branham Realty Inc.. BeachesMLS
- $450,0002 bd2 ba1.2k sqft21860 Arriba Real #4A, Boca Raton, FL 33433For SaleMLS ID #B26093917, Wendy Pressner, Signature Int'l Premier Properties. BeachesMLS
- $669,0003 bd2 ba1.5k sqft7951 Little Lane, Boca Raton, FL 33433For SaleMLS ID #B26024308, Mitchell S Stiel, Eleanor Ager Realty Inc.. BeachesMLS
- $400,0003 bd2 ba1.7k sqft21621 ARRIBA REAL #1-I, Boca Raton, FL 33433For SaleMLS ID #B26081609, Itamar Ben-Avi, 441 Realty LLC. BeachesMLS
- $595,0003 bd2 ba1.9k sqft21680 Tall Palm Circle #12-B, Boca Raton, FL 33433For SaleMLS ID #B26068206, Mark L Nestler, One Sotheby's International Realty. BeachesMLS
- $350,0002 bd2 ba1.5k sqftV, Boca Raton, FL 33433For SaleMLS ID #B26069113, Robert Brett Cuny, Agent Plus Realty. BeachesMLS
