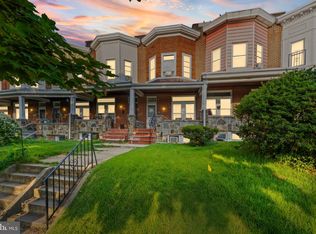
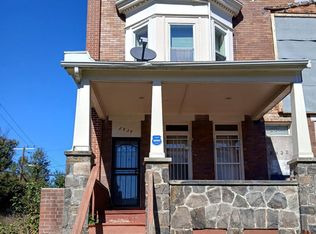
$89,200
-- bd2 ba1.1k sqft
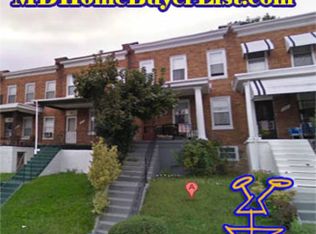
902 N Rosedale St, Baltimore, MD 21216
Off Market
Likely to sell faster than
Zillow last checked:
Listing updated:
Dimitrios Lynch 410-960-2949,
ExecuHome Realty 443-632-3000

Not available
Estimated sales range
Not available
Not available
| Date | Event | Price |
|---|---|---|
| 11/17/2026 | Listed for sale | $119,000-15%$110/sqft |
Source:  Bright MLS #MDBA2237164 Report a problem | ||
| 6/18/2026 | Listing removed | $140,000$130/sqft |
Source: Bright MLS #MDBA2198728 Report a problem | ||
| 4/8/2026 | Pending sale | $140,000$130/sqft |
Source: Bright MLS #MDBA2198728 Report a problem | ||
| 1/21/2026 | Listed for sale | $140,000$130/sqft |
Source: Bright MLS #MDBA2198728 Report a problem | ||
| 1/1/2026 | Listing removed | $140,000$130/sqft |
Source: Bright MLS #MDBA2185858 Report a problem | ||
| 11/24/2025 | Listed for sale | $140,000$130/sqft |
Source: Bright MLS #MDBA2185858 Report a problem | ||
| 10/20/2025 | Pending sale | $140,000$130/sqft |
Source: Bright MLS #MDBA2185858 Report a problem | ||
| 10/1/2025 | Price change | $140,000-4.8%$130/sqft |
Source: Bright MLS #MDBA2185858 Report a problem | ||
| 9/10/2025 | Listed for sale | $147,000-2%$136/sqft |
Source: Bright MLS #MDBA2182910 Report a problem | ||
| 9/9/2025 | Listing removed | $150,000$139/sqft |
Source: Bright MLS #MDBA2179560 Report a problem | ||
| 8/11/2025 | Listed for sale | $150,000$139/sqft |
Source: Bright MLS #MDBA2170002 Report a problem | ||
| 7/7/2025 | Pending sale | $150,000$139/sqft |
Source: Bright MLS #MDBA2170002 Report a problem | ||
| 5/29/2025 | Price change | $150,000-7.4%$139/sqft |
Source: Bright MLS #MDBA2170002 Report a problem | ||
| 5/7/2025 | Listed for sale | $162,000-4.7%$150/sqft |
Source: Bright MLS #MDBA2166726 Report a problem | ||
| 5/5/2025 | Listing removed | $170,000$157/sqft |
Source: Bright MLS #MDBA2152034 Report a problem | ||
| 1/8/2025 | Listed for sale | $170,000-1.2%$157/sqft |
Source: Bright MLS #MDBA2152034 Report a problem | ||
| 1/7/2025 | Listing removed | $172,000$159/sqft |
Source: Bright MLS #MDBA2147688 Report a problem | ||
| 11/22/2024 | Listed for sale | $172,000+161%$159/sqft |
Source: Bright MLS #MDBA2147688 Report a problem | ||
| 6/3/2005 | Sold | $65,900+1.4%$61/sqft |
Source: Public Record Report a problem | ||
| 11/16/1998 | Sold | $65,000+18.5%$60/sqft |
Source: Public Record Report a problem | ||
| 2/17/1998 | Sold | $54,860$51/sqft |
Source: Public Record Report a problem | ||
| Year | Property taxes | Tax assessment |
|---|---|---|
| 2026 | $2,440 +10.4% | $103,400 +10.4% |
| 2025 | $2,210 +11.6% | $93,633 +11.6% |
| 2024 | $1,979 +13.2% | $83,867 +13.2% |
| 2023 | $1,749 +4.9% | $74,100 |
| 2022 | $1,667 +5.2% | $74,100 +10.3% |
| 2021 | $1,585 +5.4% | $67,167 +5.4% |
| 2020 | $1,503 +1.3% | $63,700 |
| 2019 | $1,484 +1.3% | $63,700 +2.6% |
| 2018 | $1,466 +1.3% | $62,100 +1.3% |
| 2017 | $1,447 -15.7% | $61,300 |
| 2016 | $1,715 | $61,300 |
| 2015 | $1,715 | $61,300 -1% |
| 2014 | $1,715 | $61,900 |
| 2013 | -- | $61,900 |
| 2012 | -- | $61,900 -14.5% |
| 2011 | -- | $72,420 +4.3% |
| 2010 | -- | $69,440 +4.5% |
| 2009 | -- | $66,460 +4.7% |
| 2008 | -- | $63,480 +4.7% |
| 2007 | -- | $60,606 +5% |
| 2006 | -- | $57,733 +5.2% |
| 2005 | -- | $54,860 +8.5% |
| 2004 | -- | $50,562 +9.3% |
| 2003 | -- | $46,266 +10.2% |
| 2002 | -- | $41,970 +6.7% |
| 2001 | -- | $39,330 |
Source: Bright MLS. This data may not be complete. We recommend contacting the local school district to confirm school assignments for this home.
A local agent can set up tours, give advice and negotiate with sellers.