Two story apartments, studio 2nd level and two bedroom first level. This is a great investment property that needs some work to get it making you money. The roof will need replaced in the very near future, that being said…roof does not leak, and that’s the biggest expense to getting it ready for renting. Has a full unfinished dry basement with outside access and washer and dry. This would be a great starter investment for someone wanting to get into rental’s, or for investor flipper. Feel free to call or text to set up appointment for viewing.
Pending
Street View
$57,000
921 Governor St, Springfield, IL 62704
3beds
1,700sqft
MultiFamily
Built in 1957
-- sqft lot
$-- Zestimate®
$34/sqft
$-- HOA
What's special
Two bedroom first level
- 17 days
- 476
- 36
Listed by:
Property Owner (217) 461-0252
Facts & features
Interior
Bedrooms & bathrooms
- Bedrooms: 3
- Bathrooms: 2
- Full bathrooms: 2
Features
- Basement: Basement (not specified)
Interior area
- Total interior livable area: 1,700 sqft
Property
Lot
- Size: 3,920 Square Feet
Details
- Parcel number: 14330129043
Construction
Type & style
- Home type: MultiFamily
Condition
- New construction: No
- Year built: 1957
Community & HOA
Location
- Region: Springfield
Financial & listing details
- Price per square foot: $34/sqft
- Tax assessed value: $69,312
- Annual tax amount: $1,871
- Date on market: 10/30/2026
Estimated market value
Not available
Estimated sales range
Not available
$1,222/mo
Price history
| Date | Event | Price |
|---|---|---|
| 11/10/2026 | Pending sale | $57,000$34/sqft |
Source: Owner Report a problem | ||
| 10/30/2026 | Listed for sale | $57,000$34/sqft |
Source: Owner Report a problem | ||
Public tax history
| Year | Property taxes | Tax assessment |
|---|---|---|
| 2025 | $1,871 +3.4% | $23,104 +7.2% |
| 2024 | $1,810 +4% | $21,548 +9.5% |
| 2023 | $1,740 +4% | $19,682 +5.4% |
| 2022 | $1,673 +3.4% | $18,670 +3.9% |
| 2021 | $1,618 +2% | $17,971 -0.2% |
| 2020 | $1,585 +5.1% | $17,998 +0.4% |
| 2019 | $1,508 | $17,935 +0.5% |
| 2018 | $1,508 +2.1% | $17,848 +1.3% |
| 2017 | $1,477 +2% | $17,618 +1.5% |
| 2016 | $1,448 +1% | $17,361 +1.2% |
| 2015 | $1,434 -0.5% | $17,154 +0.7% |
| 2014 | $1,441 +2.3% | $17,043 -2% |
| 2013 | $1,409 +2% | $17,392 |
| 2012 | $1,382 +2.5% | $17,392 |
| 2011 | $1,348 +2.6% | $17,392 +1% |
| 2010 | $1,315 +3% | $17,225 +1.4% |
| 2009 | $1,276 +6% | $16,981 +4.2% |
| 2008 | $1,203 +1.2% | $16,295 +4.7% |
| 2007 | $1,189 +1.6% | $15,562 +3.8% |
| 2006 | $1,171 | $14,991 |
Find assessor info on the county website
Monthly payment
Est. payment
Payment breakdown
Explore the cost of this home by adjusting the details. Changes won't be saved.Climate risks
Neighborhood: Historic West Side

Similar homes
- $50,0003 bd2 ba1.4k sqft1124 S 1st St, Springfield, IL 62704New
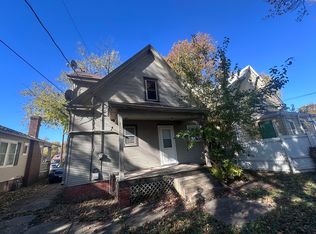 MLS ID #12806771, Eric Trujillo, RE/MAX Choice. MRED as distributed by MLS GRID
- $50,0003 bd2 ba1.4k sqft1612 W Glenn Ave, Jerome, IL 62704For Sale
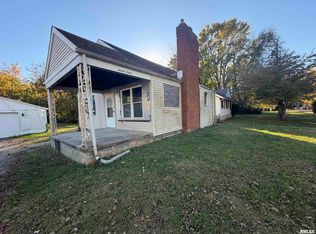
 MLS ID #CA1047762, Tracy M Shaw, Keller Williams Capital. RMLS Alliance as distributed by MLS GRID
- $65,0003 bd2 ba1.5k sqft222 E Canedy St, Springfield, IL 62704For Sale
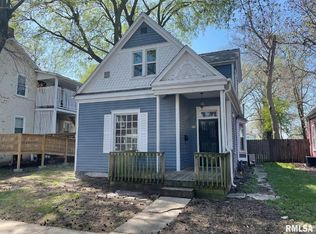 MLS ID #CA1047460, Greg Zessin, Springfield Real Estate, LLC. RMLS Alliance as distributed by MLS GRID
- $55,0004 bd2 ba1.3k sqft1915 Elizabeth St, Springfield, IL 62702For Sale
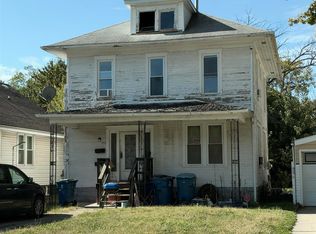 MLS ID #CA1047337, Crystal Commean, RE/MAX Professionals. RMLS Alliance as distributed by MLS GRID
- $59,9003 bd2 ba1.3k sqft1312 Enterprise St, Springfield, IL 62702For SaleMLS ID #CA1046656, Crystal Commean, RE/MAX Professionals. RMLS Alliance as distributed by MLS GRID
- $49,9004 bd2 ba1.1k sqft1514 N 11th St, Springfield, IL 62702For SaleMLS ID #CA1047842, Joseph E Tetzlaff, RE/MAX Professionals. RMLS Alliance as distributed by MLS GRID
- $69,9005 bd2 ba2.4k sqft1905 Elizabeth St, Springfield, IL 62702For SaleMLS ID #CA1047801, Joseph E Tetzlaff, RE/MAX Professionals. RMLS Alliance as distributed by MLS GRID
- $59,9002 bd1 ba1.1k sqft1119 Rutledge St, Springfield, IL 62702For SaleMLS ID #CA1046938, Diane Tinsley, The Real Estate Group, Inc.. RMLS Alliance as distributed by MLS GRID
- $72,0002 bd1 ba1.4k sqft216 E Canedy St, Springfield, IL 62704For SaleMLS ID #CA1047459, Greg Zessin, Springfield Real Estate, LLC. RMLS Alliance as distributed by MLS GRID
- $65,0003 bd2 ba1.2k sqft1117 S 12th St, Springfield, IL 62703For SaleMLS ID #CA1045384, Jerry George, The Real Estate Group, Inc.. RMLS Alliance as distributed by MLS GRID
- $47,9002 bd2 ba1.7k sqft2021 S 4th St, Springfield, IL 62703For SaleMLS ID #CA1045814, Jami R Winchester, The Real Estate Group, Inc.. RMLS Alliance as distributed by MLS GRID
- $85,0004 bd2 ba1.3k sqft620 W Lawrence Ave, Springfield, IL 62704For SaleMLS ID #CA1046904, Philip E Chiles, Keller Williams Capital. RMLS Alliance as distributed by MLS GRID
- $82,0003 bd1 ba1.2k sqft2645 S Whittier Ave, Springfield, IL 62704For SaleMLS ID #CA1047458, Greg Zessin, Springfield Real Estate, LLC. RMLS Alliance as distributed by MLS GRID
- $54,9002 bd1 ba926 sqft2204 E Adams St, Springfield, IL 62703For SaleMLS ID #CA1045330, Debra Sarsany, The Real Estate Group, Inc.. RMLS Alliance as distributed by MLS GRID
- $39,9004 bd2 ba1.2k sqft2124 S 14th St, Springfield, IL 62703For SaleMLS ID #CA1047499, Crystal Commean, RE/MAX Professionals. RMLS Alliance as distributed by MLS GRID
- $82,5003 bd2 ba1.6k sqft1821 S Spring St, Springfield, IL 62704For SaleMLS ID #CA1047081, Adam Smith, Springfield Real Estate, LLC. RMLS Alliance as distributed by MLS GRID
