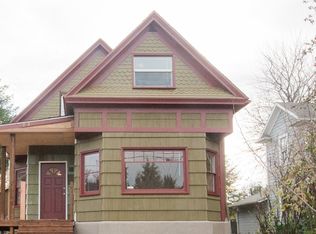
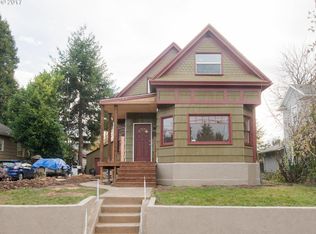
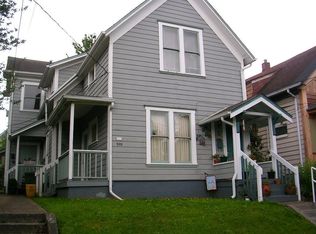
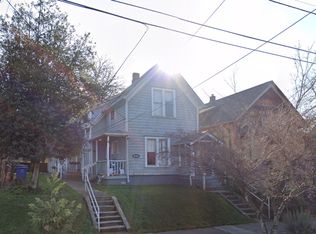
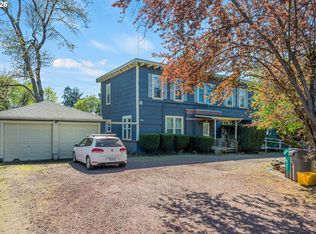
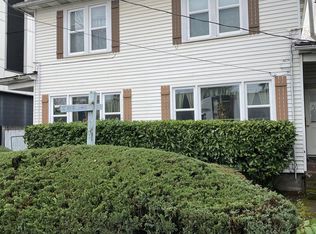
Well-maintained and in excellent condition, this triplex is truly move-in ready for investors seeking steady returns. Located in a high-demand area, it offers a rare opportunity for both seasoned investors and those making their first multi-unit purchase. With a walk score of 92 and a bike score of 99, tenants will enjoy unmatched convenience, making this an even more attractive investment. Don’t miss out on this prime opportunity!
Active
$890,000
934 SE Nehalem St, Portland, OR 97202
5beds
2,500sqft
Multi Family
Built in 1895
-- sqft lot
$-- Zestimate®
$356/sqft
$-- HOA
What's special
- 406 days |
- 537 |
- 19 |
Zillow last checked:
Listing updated:
Listed by:
Nihad Aweidah 503-939-6666,
Windermere Heritage
Source: RMLS (OR),MLS#: 364618648
Loading...
Facts & features
Interior
Bedrooms & bathrooms
- Bedrooms: 5
- Bathrooms: 3
- Full bathrooms: 3
Heating
- Ductless
Cooling
- Heat Pump, Air Conditioning
Appliances
- Included: Dishwasher, Range, Washer/Dryer, Refrigerator
Features
- Storage
- Basement: Finished,Full
Interior area
- Total structure area: 2,500
- Total interior livable area: 2,500 sqft
Property
Parking
- Total spaces: 2
- Parking features: Off Site, On Street
- Has uncovered spaces: Yes
Features
- Stories: 3
Lot
- Size: 4,791 Square Feet
- Features: Gentle Sloping, Level, SqFt 3000 to 4999
Details
- Parcel number: R266941
- Zoning: R5
Construction
Type & style
- Home type: MultiFamily
- Property subtype: Multi Family
Materials
- Shake Siding, Wood Siding
- Foundation: Concrete Perimeter
- Roof: Composition
Condition
- Updated/Remodeled
- Year built: 1895
Utilities & green energy
- Sewer: Public Sewer
- Water: Public
Community & HOA
Community
- Subdivision: Sellwood / Moreland
Location
- Region: Portland
Financial & listing details
- Price per square foot: $356/sqft
- Tax assessed value: $903,230
- Annual tax amount: $7,209
- Date on market: 5/17/2025
- Listing terms: Cash,Conventional,FHA,VA Loan
- Total actual rent: 4950
- Road surface type: Paved
Estimated market value
Not available
Estimated sales range
Not available
Not available
Price history
| Date | Event | Price |
|---|---|---|
| 6/3/2026 | Listed for sale | $890,000-3.8%$356/sqft |
Source: | ||
| 5/18/2026 | Listing removed | $925,000$370/sqft |
Source: | ||
| 5/17/2025 | Listed for sale | $925,000+23.3%$370/sqft |
Source: | ||
| 3/24/2021 | Listing removed | -- |
Source: Owner Report a problem | ||
| 10/7/2018 | Listing removed | $750,000$300/sqft |
Source: Owner Report a problem | ||
| 9/8/2018 | Listed for sale | $750,000+9.1%$300/sqft |
Source: Owner Report a problem | ||
| 1/9/2018 | Sold | $687,500-0.9%$275/sqft |
Source: | ||
| 12/7/2017 | Pending sale | $694,000$278/sqft |
Source: RealtyNET, LLC #17493496 Report a problem | ||
| 10/20/2017 | Listed for sale | $694,000+290.6%$278/sqft |
Source: RealtyNET, LLC #17493496 Report a problem | ||
| 1/9/2014 | Listing removed | $1,650$1/sqft |
Source: Owner Report a problem | ||
| 12/13/2013 | Price change | $1,650-13.2%$1/sqft |
Source: Owner Report a problem | ||
| 12/3/2013 | Listed for rent | $1,900$1/sqft |
Source: Owner Report a problem | ||
| 7/17/1998 | Sold | $177,685$71/sqft |
Source: Public Record Report a problem | ||
Public tax history
| Year | Property taxes | Tax assessment |
|---|---|---|
| 2025 | $7,209 +3.7% | $267,550 +3% |
| 2024 | $6,950 +4% | $259,760 +3% |
| 2023 | $6,683 +2.2% | $252,200 +3% |
| 2022 | $6,538 +1.7% | $244,860 +3% |
| 2021 | $6,428 +9% | $237,730 +3% |
| 2020 | $5,897 +3.8% | $230,810 +3% |
| 2019 | $5,680 | $224,090 +14.6% |
| 2018 | $5,680 +14.6% | $195,560 +3% |
| 2017 | $4,955 +14% | $189,870 +3% |
| 2016 | $4,346 | $184,340 +3% |
| 2015 | $4,346 +2.7% | $178,980 +54.6% |
| 2014 | $4,232 +56% | $115,770 +3% |
| 2013 | $2,713 +10.5% | $112,400 +3% |
| 2012 | $2,454 +3.9% | $109,130 +3% |
| 2011 | $2,362 +5.4% | $105,960 +3% |
| 2010 | $2,241 +2.7% | $102,880 +3% |
| 2009 | $2,182 +6% | $99,890 +3% |
| 2008 | $2,060 +0.3% | $96,990 +3% |
| 2007 | $2,053 +11.4% | $94,170 +3% |
| 2006 | $1,844 +4.7% | $91,430 +3% |
| 2005 | $1,761 -8.2% | $88,770 +3% |
| 2004 | $1,918 +2.3% | $86,190 +3% |
| 2003 | $1,876 +8.9% | $83,680 +3% |
| 2002 | $1,723 +7.4% | $81,250 +6.1% |
| 2000 | $1,605 | $76,600 |
Find assessor info on the county website
Monthly payment
Est. payment$--/mo
Payment breakdown
Explore the cost of this home by adjusting the details. Changes won't be saved.All calculations are estimates and provided by Zillow, Inc. for informational purposes only. Actual amounts may vary.
HOA fees may include property taxes on listings classified as Co-Ops. Contact the listing agent and/or owner for fee details.
Mortgage interest rates are dependent on a number of factors, including credit score, down payment, and repayment length. Interest rate data provided by Zillow Group Marketplace, Inc. as of 1/1/1970 from various mortgage lenders with which we have lead or other similar arrangements; the Estimated Payment is an average of those rates.
See how much you could borrow to make a competitive offer.
Climate risks
Neighborhood: Sellwood-Moreland
Getting around
37 / 100
Some TransitNearby schools
GreatSchools rating
- 10/10Llewellyn Elementary SchoolGrades: K-5Distance: 0.8 mi
- 8/10Sellwood Middle SchoolGrades: 6-8Distance: 0.4 mi
- 7/10Cleveland High SchoolGrades: 9-12Distance: 2.4 mi
Schools provided by the listing agent
- Elementary: Llewellyn
- Middle: Sellwood
- High: Cleveland
Source: RMLS (OR). This data may not be complete. We recommend contacting the local school district to confirm school assignments for this home.
A local agent can set up tours, give advice and negotiate with sellers.


- Oregon
- Multnomah County
- Portland
- 97202
- Sellwood-Moreland
- 934 SE Nehalem St
Nearby cities
Nearby neighborhoods
Nearby zip codes
Other Portland Topics
