Investor special! Once upon a time in North Avondale, this mansion was the pride of a riverboat captain. Converted to a 3 FAM, it has unfortunately fallen on hard times but with vision and investment holds great potential! One can see how unique this property was at one time and with the right investor, could be something special again with great renting potential.
For sale
$199,000
974 Burton Ave, Cincinnati, OH 45229
7beds
4,546sqft
Multi Family, Triplex
Built in 1892
-- sqft lot
$-- Zestimate®
$44/sqft
$-- HOA
What's special
- 242 days
- 649
- 28
Zillow last checked:
Listing updated:
Listed by:
Elizabeth Soloria 513-325-5404,
Sibcy Cline, Inc. 513-793-2121
Source: Cincy MLS,MLS#: 1871630 Originating MLS: Cincinnati Area Multiple Listing Service
Facts & features
Interior
Bedrooms & bathrooms
- Bedrooms: 7
- Bathrooms: 5
- Full bathrooms: 5
Heating
- Gas
Cooling
- None
Features
- Windows: Vinyl, Wood Frames
- Basement: Partial
- Number of fireplaces: 2
- Fireplace features: Wood Burning
Interior area
- Total structure area: 4,546
- Total interior livable area: 4,546 sqft
Property
Parking
- Parking features: Off Street, Driveway
- Has uncovered spaces: Yes
Features
- Stories: 3
Lot
- Size: 0.45 Acres
- Dimensions: 100 x 201
Details
- Parcel number: 1080005001600
Construction
Type & style
- Home type: MultiFamily
- Property subtype: Multi Family, Triplex
Materials
- Brick
- Foundation: Stone
- Roof: Slate
Condition
- New construction: No
- Year built: 1892
Utilities & green energy
- Gas: Natural
- Sewer: Public Sewer
- Water: Public
Community & HOA
Location
- Region: Cincinnati
Financial & listing details
- Price per square foot: $44/sqft
- Tax assessed value: $443,430
- Annual tax amount: $8,452
- Date on market: 3/13/2026
- Listing terms: No Special Financing
Estimated market value
Not available
Estimated sales range
Not available
Not available
Price history
| Date | Event | Price |
|---|---|---|
| 6/8/2026 | Price change | $199,000-20.1%$44/sqft |
Source:  Cincy MLS #1871630 Report a problem | ||
| 3/13/2026 | Listed for sale | $249,000+2456.5%$55/sqft |
Source: Cincy MLS #1871630 Report a problem | ||
| 8/26/2010 | Sold | $9,740-56.7%$2/sqft |
Source: Public Record Report a problem | ||
| 4/7/2008 | Sold | $22,500-71.9%$5/sqft |
Source: Cincy MLS #1099352 Report a problem | ||
| 6/29/2006 | Sold | $80,000-44.8%$18/sqft |
Source: Public Record Report a problem | ||
| 2/14/2003 | Sold | $145,000$32/sqft |
Source: Public Record Report a problem | ||
Public tax history
| Year | Property taxes | Tax assessment |
|---|---|---|
| 2025 | $8,460 +1.3% | $155,201 |
| 2024 | $8,355 -2.2% | $155,201 |
| 2023 | $8,543 +95.7% | $155,201 +93.2% |
| 2022 | $4,365 -25.7% | $80,322 |
| 2021 | $5,873 +5% | $80,322 |
| 2020 | $5,594 -3.8% | $80,322 +11% |
| 2019 | $5,818 +3.8% | $72,362 0% |
| 2018 | $5,605 +5% | $72,363 |
| 2017 | $5,337 +899.4% | $72,363 +897.8% |
| 2016 | $534 +5.2% | $7,252 |
| 2015 | $508 -0.5% | $7,252 |
| 2014 | $510 -1.4% | $7,252 |
| 2013 | $518 +2.2% | $7,252 |
| 2012 | $507 -67.6% | $7,252 -68.9% |
| 2011 | $1,564 +213.1% | $23,311 +196% |
| 2010 | $500 +1.7% | $7,875 |
| 2009 | $491 +1.4% | $7,875 |
| 2008 | $484 -81.7% | $7,875 -84.5% |
| 2007 | $2,647 +5.4% | $50,750 |
| 2006 | $2,512 -1% | $50,750 |
| 2005 | $2,536 +138.6% | $50,750 +102.2% |
| 2003 | $1,063 +6.4% | $25,095 |
| 2002 | $999 +7.4% | $25,095 +13.4% |
| 2001 | $931 +3.8% | $22,120 |
| 2000 | $897 | $22,120 |
Find assessor info on the county website
Monthly payment
Est. payment
Payment breakdown
Explore the cost of this home by adjusting the details. Changes won't be saved.Climate risks
Neighborhood: North Avondale

Similar homes
- $260,0007 bd-- ba3.7k sqft811 S Fred Shuttlesworth Cir, Cincinnati, OH 45229For Sale

 MLS ID #1899402, Mark McGrath, Home Information Network, Inc.. Cincy MLS
- $200,0007 bd3 ba3.2k sqft876 Hutchins Ave, Cincinnati, OH 45229For Sale
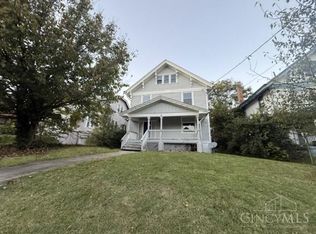 MLS ID #1898307, Angela M Ford, Alegna Realty, LLC. Cincy MLS
- $259,0006 bd3 ba4.6k sqft990 Burton Ave, Cincinnati, OH 45229For Sale
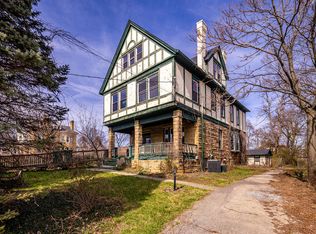
 MLS ID #970213, Arman Muradyan, Ownerland Realty, Inc.. DABR MLS
- $187,5005 bd2 ba2.5k sqft3320 Glenway Ave, Cincinnati, OH 45205For Sale
 MLS ID #1899284, Jennifer L Day, RE/MAX Preferred Group. Cincy MLS
- $199,9004 bd2 ba2.9k sqft2129 Colerain Ave, Cincinnati, OH 45214For SaleMLS ID #1878588, Timothy Settles, Trelora Realty, Inc. Cincy MLS
- $170,0006 bd2 ba2.6k sqft1729 Pulte St, Cincinnati, OH 45225For SaleMLS ID #1889100, Melissa Collins, Plum Tree Realty. Cincy MLS
- $240,0006 bd4 ba3.9k sqft2137 Colerain Ave, Cincinnati, OH 45214For SaleMLS ID #1896709, Alicia J Stoughton, Keller Williams Advisors. Cincy MLS
- $199,0004 bd2 ba2.3k sqft7222 Catalpa Rd, Cincinnati, OH 45233For SaleMLS ID #1889361, Heather R. Herr, Private Real Estate Collection. Cincy MLS
- $210,0006 bd3 ba2.2k sqft160 1st St, Addyston, OH 45001For SaleMLS ID #1877370, Sean O Plummer, Pivot Realty Group, LLC. Cincy MLS
- $154,9006 bd-- ba2.8k sqft1602 John St, Cincinnati, OH 45214For SaleMLS ID #1884129, Troy Kutcha, Plum Tree Realty. Cincy MLS
- $259,9007 bd3 ba3.4k sqft540 Grand Ave, Cincinnati, OH 45205For SaleMLS ID #1889490, Arthur Greenlee IV, eXp Realty. Cincy MLS
- $250,0005 bd3 ba2.5k sqft2200 Lawn Ave, Cincinnati, OH 45212For SaleMLS ID #1896555, Kyle Sticklen, Sibcy Cline, Inc.. Cincy MLS
- $275,0004 bd2 ba2.7k sqft4110 Jerome Ave, Cincinnati, OH 45223For SaleMLS ID #1890201, Brett A Keppler, TREO REALTORS. Cincy MLS
- $285,0004 bd2 ba2.3k sqft1716 Carrahen Ave, Cincinnati, OH 45237For SaleMLS ID #1896420, Anthony Vanjohnson, eXp Realty. Cincy MLS
- $165,0004 bd2 ba2.6k sqft4307 Delridge Dr, Cincinnati, OH 45205For SaleMLS ID #972105, Peter J Duffy, Comey & Shepherd REALTORS. DABR MLS
- $270,0004 bd2 ba2.3k sqft2883 Temple Ave, Cincinnati, OH 45211For SaleMLS ID #1896225, Cindy J Shetterly, Keller Williams Distinctive RE. Cincy MLS
- $270,0005 bd2 ba3.4k sqft2539 Ingleside Ave, Cincinnati, OH 45206For SaleMLS ID #1895181, Gregory Pipkins, Movement Realty. Cincy MLS
- $145,9004 bd2 ba2.4k sqft1461 Kinney Ave, Cincinnati, OH 45231For SaleMLS ID #1866506, Matthew Kalogeras, Trelora Realty, Inc. Cincy MLS
