$78,300
1 bd|1 ba|504 sqft
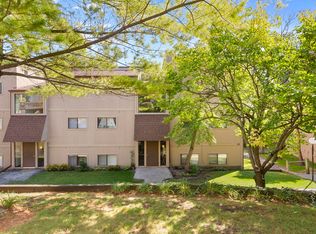
54 Vail Colony APT 1, Fox Lake, IL 60020
Off Market

Zillow last checked:
Kari Torkelson 636-578-0425,
Kale Realty
Not available
Estimated sales range
Not available
Not available
| Date | Event | Price |
|---|---|---|
| 4/4/2018 | Listing removed | $65,000$87/sqft |
Source: Results Realty USA #09829468 Report a problem | ||
| 3/5/2018 | Pending sale | $65,000$87/sqft |
Source: Results Realty USA #09829468 Report a problem | ||
| 2/27/2018 | Listed for sale | $65,000$87/sqft |
Source: Results Realty USA #09829468 Report a problem | ||
| 2/20/2018 | Pending sale | $65,000$87/sqft |
Source: Results Realty USA #09829468 Report a problem | ||
| 1/9/2018 | Listed for sale | $65,000+12.3%$87/sqft |
Source: Results Realty USA #09829468 Report a problem | ||
| 9/8/2015 | Listing removed | $57,900$77/sqft |
Source: Lake Homes Unlimited #08970302 Report a problem | ||
| 7/15/2015 | Listed for sale | $57,900+17%$77/sqft |
Source: Lake Homes Unlimited #08970302 Report a problem | ||
| 12/9/2014 | Listing removed | $49,500$66/sqft |
Source: Results Realty USA Report a problem | ||
| 11/15/2014 | Listed for sale | $49,500-60.4%$66/sqft |
Source: Results Realty USA Report a problem | ||
| 12/1/2008 | Sold | $125,000+58.2%$167/sqft |
Source: Public Record Report a problem | ||
| 8/29/2006 | Sold | $79,000+23.4%$105/sqft |
Source: Public Record Report a problem | ||
| 5/28/2002 | Sold | $64,000+18.5%$85/sqft |
Source: Public Record Report a problem | ||
| 11/4/1996 | Sold | $54,000$72/sqft |
Source: Public Record Report a problem | ||
| Year | Property taxes | Tax assessment |
|---|---|---|
| 2023 | $2,391 +17.5% | $30,222 +11.7% |
| 2022 | $2,035 +8% | $27,061 +26.2% |
| 2021 | $1,885 +2.8% | $21,439 +10.2% |
| 2020 | $1,833 +3.3% | $19,453 +4.6% |
| 2019 | $1,775 +6.4% | $18,602 +6.3% |
| 2018 | $1,668 | $17,500 +5.1% |
| 2017 | $1,668 +53.2% | $16,657 +3.6% |
| 2016 | $1,089 -41.9% | $16,075 +2.6% |
| 2015 | $1,873 +0.7% | $15,666 -31% |
| 2014 | $1,860 -1.5% | $22,701 -4.5% |
| 2012 | $1,888 +6.4% | $23,761 -11.1% |
| 2011 | $1,775 +8.8% | $26,739 -2.4% |
| 2010 | $1,631 -4.8% | $27,402 -11.8% |
| 2009 | $1,714 -0.7% | $31,058 -0.3% |
| 2008 | $1,727 +9.9% | $31,141 +5.1% |
| 2006 | $1,571 +5.3% | $29,635 |
| 2005 | $1,492 +4.2% | -- |
| 2004 | $1,432 +0.6% | -- |
| 2003 | $1,423 -5.9% | -- |
| 2002 | $1,512 +96.3% | -- |
| 2001 | $770 -48.8% | $20,116 +3.3% |
| 2000 | $1,504 | $19,475 |
Source: MRED as distributed by MLS GRID. This data may not be complete. We recommend contacting the local school district to confirm school assignments for this home.
A local agent can set up tours, give advice and negotiate with sellers.