$388,300
3 bd|2 ba|1.8k sqft
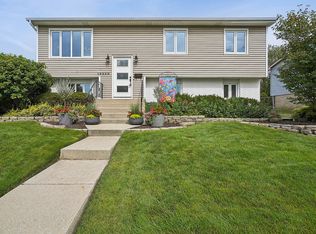
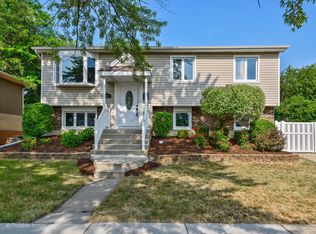
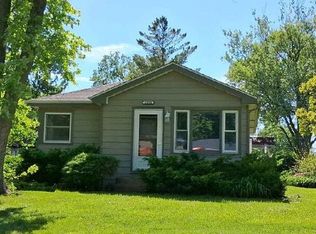
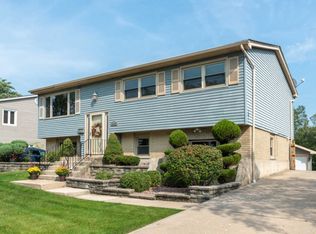
16357 Olcott Ave, Tinley Park, IL 60477
Off Market
Likely to sell faster than
Zillow last checked:
Listing updated:
Jessica Burtch (708)516-4787,
Realtopia Real Estate Inc
Not available
Estimated sales range
Not available
Not available
| Date | Event | Price |
|---|---|---|
| 6/19/2026 | Listed for sale | $350,000+19344.4%$335/sqft |
Source: | ||
| 4/21/2014 | Sold | $1,800-99.2%$2/sqft |
Source: Agent Provided Report a problem | ||
| 3/22/2014 | Price change | $218,400-0.7%$209/sqft |
Source: CENTURY 21 Pride Realty #08460570 Report a problem | ||
| 3/11/2014 | Price change | $219,900-2.2%$211/sqft |
Source: CENTURY 21 Pride Realty #08460570 Report a problem | ||
| 11/5/2013 | Price change | $224,900-2.2%$215/sqft |
Source: CENTURY 21 Pride Realty #08460570 Report a problem | ||
| 10/9/2013 | Listed for sale | $229,900+14.9%$220/sqft |
Source: CENTURY 21 Pride Realty #08460570 Report a problem | ||
| 6/27/2008 | Sold | $200,000+4.7%$192/sqft |
Source: Public Record Report a problem | ||
| 12/10/2002 | Sold | $191,000+32.2%$183/sqft |
Source: Public Record Report a problem | ||
| 4/28/1998 | Sold | $144,500$138/sqft |
Source: Public Record Report a problem | ||
| Year | Property taxes | Tax assessment |
|---|---|---|
| 2024 | -- | $29,000 |
| 2023 | $7,131 +23.9% | $29,000 +48.2% |
| 2022 | $5,756 +2.8% | $19,565 |
| 2021 | $5,602 +1.2% | $19,565 |
| 2020 | $5,533 +5.8% | $19,565 +0% |
| 2019 | $5,230 +2.2% | $19,557 |
| 2018 | $5,117 -13.2% | $19,557 -12.9% |
| 2017 | $5,896 +4.6% | $22,462 +15.4% |
| 2016 | $5,635 +1.8% | $19,463 |
| 2015 | $5,533 +0.5% | $19,463 |
| 2014 | $5,504 +10.3% | $19,463 +1.6% |
| 2013 | $4,989 +2.2% | $19,148 |
| 2012 | $4,883 +2.6% | $19,148 |
| 2011 | $4,760 -3.1% | $19,148 -20% |
| 2010 | $4,910 +12% | $23,938 |
| 2009 | $4,384 +9.6% | $23,938 -5% |
| 2008 | $4,002 +1% | $25,198 +6% |
| 2007 | $3,961 +9.5% | $23,780 |
| 2006 | $3,617 +3.9% | $23,780 |
| 2005 | $3,481 -2.4% | $23,780 +42.9% |
| 2004 | $3,567 +10.2% | $16,644 |
| 2003 | $3,238 +3.6% | $16,644 |
| 2002 | $3,125 +15.1% | $16,644 +7.4% |
| 2001 | $2,715 +2.5% | $15,503 |
| 2000 | $2,650 +1.2% | $15,503 |
| 1999 | $2,618 | $15,503 |
Find assessor info on the county website
Source: MRED as distributed by MLS GRID. This data may not be complete. We recommend contacting the local school district to confirm school assignments for this home.
A local agent can set up tours, give advice and negotiate with sellers.