Nice property. In a quiet neighborhood
One or 2 years. No evictions
Pre-foreclosure
Est. $371,800
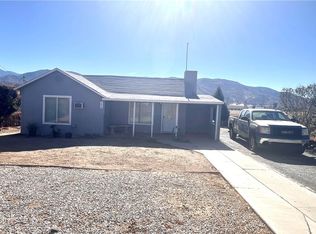
1026 E Nicolet St, Banning, CA 92220
3beds
1,262sqft
Single Family Residence
Built in ----
-- sqft lot
$371,800 Zestimate®
$295/sqft
$-- HOA
Overview
- 66 days
- 19
- 3
Zillow last checked:
Listing updated:
Source: Zillow Rentals
Facts & features
Interior
Bedrooms & bathrooms
- Bedrooms: 3
- Bathrooms: 2
- Full bathrooms: 2
Heating
- Forced Air, Wall Furnace
Cooling
- Central Air, Window Unit
Appliances
- Included: Dishwasher
- Laundry: None
Features
- Flooring: Carpet
Interior area
- Total interior livable area: 1,262 sqft
Property
Parking
- Details: Contact manager
Features
- Exterior features: Heating system: Forced Air, Heating system: Wall
Details
- Parcel number: 541121010
Construction
Type & style
- Home type: SingleFamily
- Property subtype: Single Family Residence
Community & HOA
Community
- Deposit fee: $2,800
Location
- Region: Banning
Financial & listing details
- Price per square foot: $295/sqft
- Tax assessed value: $379,744
- Date on market: 3/1/2025
- Date available: 03/01/2025
- Lease term: 1 Year
Foreclosure details
Estimated market value
$371,800
$331,000 - $405,000
$2,558/mo
Price history
| Date | Event | Price |
|---|---|---|
| 3/22/2025 | Listing removed | $2,800$2/sqft |
Source: Zillow Rentals Report a problem | ||
| 3/1/2025 | Listed for rent | $2,800$2/sqft |
Source: Zillow Rentals Report a problem | ||
| 11/17/2004 | Sold | $130,000$103/sqft |
Source: Public Record Report a problem | ||
Public tax history
| Year | Property taxes | Tax assessment |
|---|---|---|
| 2026 | -- | $379,744 +2% |
| 2025 | $5,177 +2% | $372,299 +2% |
| 2024 | $5,074 +984.1% | $365,000 +917.6% |
| 2023 | $468 +2.3% | $35,868 +2% |
| 2022 | $458 +2.1% | $35,166 +2% |
| 2021 | $448 +1.7% | $34,478 +1% |
| 2020 | $441 +1.9% | $34,125 +2% |
| 2019 | $432 +1.4% | $33,457 +2% |
| 2018 | $427 +2.4% | $32,802 +2% |
| 2017 | $417 | $32,160 +2% |
| 2016 | $417 +7.2% | $31,531 +1.5% |
| 2015 | $389 +1.2% | $31,060 +2% |
| 2014 | $384 | $30,454 +0.4% |
| 2013 | -- | $30,319 +2% |
| 2012 | -- | $29,726 +2% |
| 2011 | -- | $29,145 +0.7% |
| 2010 | -- | $28,929 -0.2% |
| 2009 | -- | $29,000 +2% |
| 2008 | -- | $28,432 +2% |
| 2007 | -- | $27,875 +2% |
| 2006 | -- | $27,330 +2% |
| 2005 | -- | $26,795 +3.9% |
| 2003 | -- | $25,791 +2% |
| 2002 | -- | $25,286 +2% |
| 2001 | $212 +2.7% | $24,791 +2% |
| 2000 | $206 | $24,306 |
Find assessor info on the county website
Monthly payment
Climate risks
Neighborhood: 92220

Similar homes
- $349,0002 bd1 ba959 sqft581 E Hoffer St, Banning, CA 92220For Sale
 MLS ID #219154814DA, Tanya Moreno, C 21 Coachella Valley RE. CRMLS
- $375,0004 bd2 ba1.4k sqft655 N Blanchard St, Banning, CA 92220For Sale
 MLS ID #IV26092048, GRISELDA TORRES, Realty One Group Empire. CRMLS
- $385,0003 bd2 ba1k sqft1010 E Nicolet St, Banning, CA 92220For Sale
 MLS ID #DW25025231, Lourdes Buenavides, Equity Smart Real Estate Serv. CRMLS
- $359,0003 bd2 ba1.4k sqft992 W Hoffer St, Banning, CA 92220For Sale
 MLS ID #PW26224279, Anthony Arana, Executive Bankers Realty. CRMLS
