This 1040 square foot single family home has 2 bedrooms and 1.0 bathrooms. This home is located at 104 Baxter St, Vallejo, CA 94590.
Pre-foreclosure
Street View
Est. $478,700
104 Baxter St, Vallejo, CA 94590
2beds
1baths
1,040sqft
SingleFamily
Built in 1910
8,712 Square Feet Lot
$478,700 Zestimate®
$460/sqft
$-- HOA
Overview
- 51 days
- 4
- 0
Facts & features
Interior
Bedrooms & bathrooms
- Bedrooms: 2
- Bathrooms: 1
Heating
- Other
Cooling
- None
Interior area
- Total interior livable area: 1,040 sqft
Property
Parking
- Parking features: None
Lot
- Size: 8,712 Square Feet
Details
- Parcel number: 0051370010
Construction
Type & style
- Home type: SingleFamily
Condition
- Year built: 1910
Community & HOA
Location
- Region: Vallejo
Financial & listing details
- Price per square foot: $460/sqft
- Tax assessed value: $509,379
Foreclosure details
Estimated market value
$478,700
$445,000 - $507,000
$2,584/mo
Price history
| Date | Event | Price |
|---|---|---|
| 2/3/2026 | Listing removed | $499,000$480/sqft |
Source:  BAREIS #325093674 Report a problem | ||
| 12/23/2025 | Listed for sale | $499,000$480/sqft |
Source: BAREIS #325093674 Report a problem | ||
| 12/16/2025 | Pending sale | $499,000$480/sqft |
Source: BAREIS #325093674 Report a problem | ||
| 11/17/2025 | Price change | $499,000-3.9%$480/sqft |
Source: BAREIS #325093674 Report a problem | ||
| 10/29/2025 | Listed for sale | $519,000-2.4%$499/sqft |
Source: BAREIS #325093674 Report a problem | ||
| 2/7/2025 | Listing removed | $532,000$512/sqft |
Source: BAREIS #324085296 Report a problem | ||
| 12/13/2024 | Price change | $532,000-0.9%$512/sqft |
Source: BAREIS #324085296 Report a problem | ||
| 10/28/2024 | Listed for sale | $537,000+11.9%$516/sqft |
Source: BAREIS #324085296 Report a problem | ||
| 9/23/2022 | Sold | $480,000+6.2%$462/sqft |
Source: BAREIS #322068991 Report a problem | ||
| 9/21/2022 | Pending sale | $452,000$435/sqft |
Source: BAREIS #322068991 Report a problem | ||
| 9/8/2022 | Listing removed | -- |
Source: BAREIS #322068991 Report a problem | ||
| 9/8/2022 | Pending sale | $452,000-1.5%$435/sqft |
Source: BAREIS #322068991 Report a problem | ||
| 9/7/2022 | Listing removed | -- |
Source: Zillow Rental Network Premium Report a problem | ||
| 8/24/2022 | Listed for rent | $2,400$2/sqft |
Source: Zillow Rental Network Premium Report a problem | ||
| 8/15/2022 | Price change | $459,000-2.3%$441/sqft |
Source: BAREIS #322068991 Report a problem | ||
| 8/5/2022 | Price change | $469,900-2.1%$452/sqft |
Source: BAREIS #322068991 Report a problem | ||
| 7/27/2022 | Listed for sale | $480,000+300%$462/sqft |
Source: BAREIS #322068991 Report a problem | ||
| 2/17/2010 | Sold | $120,000+0.1%$115/sqft |
Source: Public Record Report a problem | ||
| 12/4/2009 | Price change | $119,900-69.1%$115/sqft |
Source: foreclosure.com Report a problem | ||
| 11/28/2009 | Listed for sale | -- |
Source: foreclosure.com Report a problem | ||
| 9/1/2009 | Listing removed | -- |
Source: foreclosure.com Report a problem | ||
| 8/23/2009 | Listed for sale | -- |
Source: foreclosure.com Report a problem | ||
| 8/5/2009 | Sold | $387,706+10.8%$373/sqft |
Source: Public Record Report a problem | ||
| 9/29/2006 | Sold | $350,000$337/sqft |
Source: Public Record Report a problem | ||
Public tax history
| Year | Property taxes | Tax assessment |
|---|---|---|
| 2026 | -- | $509,379 +2% |
| 2025 | $6,873 +3% | $499,392 +2% |
| 2024 | $6,675 +152.2% | $489,600 +228.9% |
| 2023 | $2,647 -1.9% | $148,875 +2% |
| 2022 | $2,699 +8.7% | $145,956 +2% |
| 2021 | $2,483 +0.3% | $143,096 +1% |
| 2020 | $2,477 -2.6% | $141,629 +2% |
| 2019 | $2,542 +14.4% | $138,853 +2% |
| 2018 | $2,221 +5.5% | $136,131 +2% |
| 2017 | $2,106 +37.1% | $133,463 +2% |
| 2016 | $1,536 +1.3% | $130,847 +1.5% |
| 2015 | $1,516 +1.4% | $128,882 +2% |
| 2014 | $1,495 | $126,358 +0.5% |
| 2013 | -- | $125,787 +46.3% |
| 2012 | -- | $86,000 -3.4% |
| 2011 | -- | $89,000 -26.4% |
| 2010 | -- | $121,000 |
Find assessor info on the county website
Monthly payment
Climate risks
Neighborhood: vallejo heights


Similar homes
- $525,0003 bd2 ba960 sqft720 Wilson Avenue, Vallejo, CA 94590For Sale
 MLS ID #326088259, Helen Yong, eXp Realty of California, Inc. BAREIS
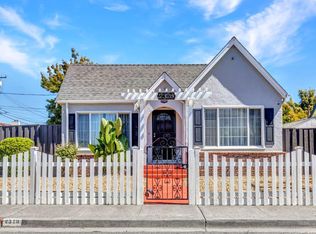
- $474,9003 bd1 ba916 sqft2328 Napa Street, Vallejo, CA 94590For Sale
 MLS ID #326078929, Maggie D Celestini, Level Up Realty - Solari Group. BAREIS
- $549,9004 bd2 ba1.2k sqft322 Coghlan St, Vallejo, CA 94590For Sale
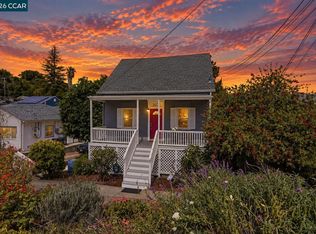 MLS ID #41148665, Jenniffer Jimenez. CCAR
- $499,0003 bd1 ba1.2k sqft1612 Napa Street, Vallejo, CA 94590For Sale
 MLS ID #326052199, Julie Becker, Momentum Realty Group. BAREIS
