Attention Investors! Looking to scale? This property is part of a larger offering of nine single-family investment properties throughout Akron and Canton. Properties are available individually or as a complete portfolio, providing flexibility to acquire one property or pursue a larger investment strategy. Property addresses that are included: in Canton- 2317 11th, 2824 9th, 2801 12th. In Akron- 973 Whittier, 2058 16th, 1046 6thm 1214 Bellows, 852 Lawton. Package Price $959,500.
This home is tenant occupied and rented for $1099/month.
Active
$106,900
1057 Joy Ave, Akron, OH 44306
3beds
1,176sqft
Single Family Residence
Built in 1919
5,880 Square Feet Lot
$-- Zestimate®
$91/sqft
$-- HOA
What's special
- 13 hours
- 33
- 3
Zillow last checked:
Listing updated:
Listed by:
Lisa A Mazzola 216-323-7071 lmazzolac21@gmail.com,
Century 21 Wilbur Realty
Source: MLS Now,MLS#: 5254371 Originating MLS: Akron Cleveland Association of REALTORS
Facts & features
Interior
Bedrooms & bathrooms
- Bedrooms: 3
- Bathrooms: 1
- Full bathrooms: 1
Heating
- Gas
Cooling
- Central Air
Appliances
- Laundry: In Basement
Features
- Basement: Full
- Has fireplace: No
Interior area
- Total structure area: 1,176
- Total interior livable area: 1,176 sqft
- Finished area above ground: 1,176
Property
Parking
- Total spaces: 1
- Parking features: Detached, Garage
- Garage spaces: 1
Features
- Levels: Two
- Stories: 2
Lot
- Size: 5,880 Square Feet
Details
- Parcel number: 6811204
- Special conditions: Standard
Construction
Type & style
- Home type: SingleFamily
- Architectural style: Colonial
- Property subtype: Single Family Residence
Materials
- Aluminum Siding
- Roof: Asphalt,Fiberglass
Condition
- Year built: 1919
Utilities & green energy
- Sewer: Public Sewer
- Water: Public
Community & HOA
Community
- Subdivision: Waverly Park
HOA
- Has HOA: No
Location
- Region: Akron
Financial & listing details
- Price per square foot: $91/sqft
- Tax assessed value: $52,620
- Annual tax amount: $1,248
- Date on market: 10/21/2026
- Cumulative days on market: 3 days
Estimated market value
Not available
Estimated sales range
Not available
Not available
Price history
| Date | Event | Price |
|---|---|---|
| 10/21/2026 | Listed for sale | $106,900+25.8%$91/sqft |
Source:  MLS Now #5254371 Report a problem | ||
| 9/21/2025 | Listing removed | $1,099$1/sqft |
Source: Zillow Rentals Report a problem | ||
| 8/19/2025 | Price change | $1,099-7.6%$1/sqft |
Source: Zillow Rentals Report a problem | ||
| 8/16/2025 | Price change | $1,190-8.1%$1/sqft |
Source: Zillow Rentals Report a problem | ||
| 7/17/2025 | Price change | $1,295-4.1%$1/sqft |
Source: Zillow Rentals Report a problem | ||
| 6/30/2025 | Listed for rent | $1,350+13%$1/sqft |
Source: Zillow Rentals Report a problem | ||
| 6/24/2025 | Sold | $85,000+4.9%$72/sqft |
Source: MLS Now #5116690 Report a problem | ||
| 4/25/2025 | Pending sale | $81,000$69/sqft |
Source: MLS Now #5116690 Report a problem | ||
| 4/23/2025 | Listed for sale | $81,000+29.6%$69/sqft |
Source: MLS Now #5116690 Report a problem | ||
| 4/12/2023 | Listing removed | -- |
Source: Zillow Rentals Report a problem | ||
| 2/3/2023 | Price change | $1,195-7.7%$1/sqft |
Source: Zillow Rentals Report a problem | ||
| 1/19/2023 | Listed for rent | $1,295+52.4%$1/sqft |
Source: Zillow Rentals Report a problem | ||
| 1/17/2023 | Sold | $62,500-10.6%$53/sqft |
Source: MLS Now #4424017 Report a problem | ||
| 12/15/2022 | Pending sale | $69,900$59/sqft |
Source: MLS Now #4424017 Report a problem | ||
| 12/6/2022 | Price change | $69,900-12.5%$59/sqft |
Source: MLS Now #4424017 Report a problem | ||
| 11/28/2022 | Pending sale | $79,900$68/sqft |
Source: MLS Now #4424017 Report a problem | ||
| 11/17/2022 | Listed for sale | $79,900$68/sqft |
Source: MLS Now #4424017 Report a problem | ||
| 11/15/2022 | Listing removed | -- |
Source: Owner Report a problem | ||
| 10/24/2022 | Listed for sale | $79,900+230.2%$68/sqft |
Source: Owner Report a problem | ||
| 3/24/2021 | Listing removed | -- |
Source: Owner Report a problem | ||
| 6/3/2019 | Listing removed | $850$1/sqft |
Source: Owner Report a problem | ||
| 5/31/2019 | Listed for rent | $850$1/sqft |
Source: Owner Report a problem | ||
| 4/30/2019 | Sold | $24,200-6.9%$21/sqft |
Source: Public Record Report a problem | ||
| 3/15/2019 | Pending sale | $26,000$22/sqft |
Source: Stouffer Realty, Inc. #4036335 Report a problem | ||
| 1/14/2019 | Price change | $26,000-25.7%$22/sqft |
Source: Stouffer Realty, Inc. #4036335 Report a problem | ||
| 9/11/2018 | Listed for sale | $35,000+27.3%$30/sqft |
Source: Stouffer Realty, Inc. #4036335 Report a problem | ||
| 6/27/2018 | Listing removed | $27,500$23/sqft |
Source: Stouffer Realty, Inc. #3964092 Report a problem | ||
| 7/6/2006 | Sold | $27,500+83.3%$23/sqft |
Source: Public Record Report a problem | ||
| 5/31/1996 | Sold | $15,000$13/sqft |
Source: Public Record Report a problem | ||
Public tax history
| Year | Property taxes | Tax assessment |
|---|---|---|
| 2025 | $1,249 +0.2% | $18,420 |
| 2024 | $1,247 +19.1% | $18,420 |
| 2023 | $1,047 +31.7% | $18,420 +72% |
| 2022 | $795 -0.1% | $10,707 |
| 2021 | $795 | $10,707 |
| 2020 | -- | $10,707 +0% |
| 2019 | $1,370 +62.2% | $10,704 +0% |
| 2018 | $844 -1.5% | $10,700 |
| 2017 | $857 | $10,700 |
| 2016 | $857 | $10,700 |
| 2015 | $857 +0.8% | $10,700 |
| 2014 | $851 -3.2% | $10,700 -5.6% |
| 2013 | $879 +1.3% | $11,330 |
| 2012 | $867 +21% | $11,330 -0.1% |
| 2011 | $717 -8.9% | $11,337 -13.2% |
| 2010 | $787 | $13,055 |
| 2009 | -- | $13,055 |
| 2008 | $837 -6.2% | $13,055 -11.5% |
| 2007 | $893 +0% | $14,750 -3.7% |
| 2006 | $892 -23.6% | $15,310 |
| 2005 | $1,168 | $15,310 +7% |
| 2004 | -- | $14,312 |
| 2003 | $711 -0.7% | $14,312 |
| 2002 | $716 -48.6% | $14,312 +44% |
| 2001 | $1,394 +87.1% | $9,937 |
| 2000 | $745 | $9,937 |
Find assessor info on the county website
Monthly payment
Est. payment
Payment breakdown
Explore the cost of this home by adjusting the details. Changes won't be saved.Climate risks
Neighborhood: East Akron
Nearby schools
Similar homes
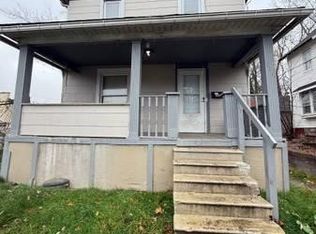
- $99,3003 bd1 ba1.2k sqft1046 6th Ave, Akron, OH 44306For Sale
 MLS ID #5254409, Lisa A Mazzola, Century 21 Wilbur Realty. MLS Now
- $109,9004 bd2 ba1.5k sqft450 Lucy St, Akron, OH 44306For Sale
 MLS ID #5238800, Candice Eberhardt, Eberhardt Realty LLC. MLS Now
- $119,9003 bd1 ba1.1k sqft1009 Pardee Ave, Akron, OH 44306For Sale
 MLS ID #5245396, Leda A Lambdin, RE/MAX Trends Realty. MLS Now
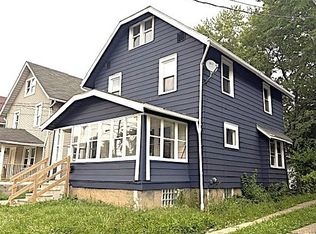
- $107,0004 bd2 ba1.2k sqft877 Hammel St, Akron, OH 44306For Sale
 MLS ID #5193854, Leilani M Bowersock, Coldwell Banker Schmidt Realty. MLS Now
