Presenting an exceptional opportunity at 109 Blueberry Ln, Barnstable, MA, a distinguished single-family residence, completely renovated in 2020, with stain steel appliances. This property offers 1424 square feet of meticulously designed living space, set upon a generous 10019 square foot lot, providing a compelling blend of classic charm and modern potential. The residence encompasses three well-appointed bedrooms with a master bedroom, walking closet, each designed to offer comfort and privacy. These spaces provide versatile options for family living, guest accommodation. Complementing the back yard with a large patio, thoughtfully integrated to serve the household's needs with functionality and ease. The open floor concepted include dinner/kitchen, living room and family room with a fireplace, this property represents a unique offering for those seeking an established residence with significant lifestyle appeal in Barnstable
For sale
$669,000
109 Blueberry Lane, Marstons Mills, MA 02648
3beds
1,724sqft
Single Family Residence
Built in 1961
10,018 Square Feet Lot
$659,400 Zestimate®
$388/sqft
$6/mo HOA
What's special
Large patioMaster bedroomWalking closetThree well-appointed bedrooms
- 21 days
- 345
- 15
Zillow last checked:
Listing updated:
Listed by:
Mario A Neno 978-201-9691,
Mega Realty Services, Inc.
Source: CCIMLS,MLS#: 22602674
Facts & features
Interior
Bedrooms & bathrooms
- Bedrooms: 3
- Bathrooms: 2
- Full bathrooms: 2
Heating
- Natural Gas
Cooling
- Central Air
Appliances
- Included: Natural Gas, Tankless Water Heater
- Laundry: Electric Dryer Hookup, Washer Hookup
Features
- Pantry
- Flooring: Wood, Tile
- Basement: Finished,Partial
- Number of fireplaces: 1
Interior area
- Total structure area: 1,724
- Total interior livable area: 1,724 sqft
Property
Parking
- Parking features: Driveway, Off Street
- Has uncovered spaces: Yes
Features
- Stories: 1
- Patio & porch: Patio
- Fencing: Full
Lot
- Size: 10,018 Square Feet
Details
- Parcel number: MMIL M:102 L:113
- Special conditions: Standard
Construction
Type & style
- Home type: SingleFamily
- Property subtype: Single Family Residence
Materials
- Shingle Siding
- Roof: Asphalt,Shingle
Condition
- Year built: 1961
Utilities & green energy
- Water: Public
Community & HOA
Community
- Features: Deeded Beach Rights
HOA
- Has HOA: Yes
- Amenities included: Beach Access
- HOA fee: $75 annually
Location
- Region: Marstons Mills
Financial & listing details
- Price per square foot: $388/sqft
- Tax assessed value: $490,000
- Annual tax amount: $3,450
- Date on market: 9/29/2026
- Cumulative days on market: 34 days
Estimated market value
$659,400
$626,000 - $692,000
$3,437/mo
Price history
| Date | Event | Price |
|---|---|---|
| 9/29/2026 | Listed for sale | $669,000-4.4%$388/sqft |
Source: MLS PIN #73530452 Report a problem | ||
| 8/17/2026 | Listing removed | $699,900$406/sqft |
Source:  CCIMLS #22602674 Report a problem | ||
| 6/18/2026 | Listed for sale | $699,900+324.2%$406/sqft |
Source: MLS PIN #73530452 Report a problem | ||
| 4/9/2019 | Sold | $165,000-17.5%$96/sqft |
Source: CCIMLS #21900522 Report a problem | ||
| 3/14/2019 | Pending sale | $199,900$116/sqft |
Source: Keller Williams Realty Cape Cod and the Islands #21900522 Report a problem | ||
| 3/14/2019 | Listed for sale | $199,900$116/sqft |
Source: Keller Williams Realty Cape Cod and the Islands #21900522 Report a problem | ||
| 2/23/2019 | Pending sale | $199,900$116/sqft |
Source: Keller Williams Realty Cape Cod and the Islands #2166666 Report a problem | ||
| 1/29/2019 | Price change | $199,900-8.7%$116/sqft |
Source: Keller Williams Realty Cape Cod and the Islands #2166666 Report a problem | ||
| 11/15/2018 | Price change | $219,000-6.2%$127/sqft |
Source: Keller Williams Realty Cape Cod and the Islands #2166666 Report a problem | ||
| 10/30/2018 | Listed for sale | $233,500-2.3%$135/sqft |
Source: Keller Williams Realty Cape Cod and the Islands #2166666 Report a problem | ||
| 10/6/2016 | Listing removed | $239,000$139/sqft |
Source: Keller Williams - Cape Cod and the Islands #21608532 Report a problem | ||
| 10/4/2016 | Listed for sale | $239,000-2.8%$139/sqft |
Source: Keller Williams - Cape Cod and the Islands #21608532 Report a problem | ||
| 8/30/2016 | Listing removed | $245,900$143/sqft |
Source: EXIT Cape Realty #21508849 Report a problem | ||
| 11/24/2015 | Price change | $245,900-2%$143/sqft |
Source: EXIT Cape Realty #21508849 Report a problem | ||
| 9/9/2015 | Listed for sale | $250,900+11.5%$146/sqft |
Source: EXIT Cape Realty #21508849 Report a problem | ||
| 9/9/2015 | Listing removed | $1,450$1/sqft |
Source: EXIT Cape Realty #21508236 Report a problem | ||
| 8/22/2015 | Listed for rent | $1,450$1/sqft |
Source: EXIT Cape Realty #21508236 Report a problem | ||
| 2/3/2014 | Sold | $225,000$131/sqft |
Source: CCIMLS #21310963 Report a problem | ||
| 1/18/2014 | Pending sale | $225,000$131/sqft |
Source: Robert Paul Properties, Inc. #21310963 Report a problem | ||
| 10/2/2013 | Price change | $225,000-9.6%$131/sqft |
Source: Robert Paul Properties, Inc #71517818 Report a problem | ||
| 7/20/2013 | Price change | $249,000-7.4%$144/sqft |
Source: Robert Paul Properties, Inc #71517818 Report a problem | ||
| 5/19/2013 | Price change | $269,000-3.9%$156/sqft |
Source: Robert Paul Properties, Inc #71517818 Report a problem | ||
| 2/2/2013 | Listed for sale | $279,900$162/sqft |
Source: Robert Paul Properties Inc. #21300862 Report a problem | ||
Public tax history
| Year | Property taxes | Tax assessment |
|---|---|---|
| 2025 | $3,964 +5.2% | $490,000 +1.6% |
| 2024 | $3,768 +6.5% | $482,400 +13.7% |
| 2023 | $3,539 +5.5% | $424,300 +21.9% |
| 2022 | $3,356 +6.1% | $348,100 +15.5% |
| 2021 | $3,162 -1.4% | $301,400 +3% |
| 2020 | $3,208 +5.4% | $292,700 +8.4% |
| 2019 | $3,044 +14.8% | $269,900 +14.2% |
| 2018 | $2,652 +7.7% | $236,400 +3.3% |
| 2017 | $2,463 -2.1% | $228,900 -0.8% |
| 2016 | $2,515 +3.6% | $230,700 +3.1% |
| 2015 | $2,428 +2.1% | $223,800 |
| 2014 | $2,379 +3.8% | $223,800 |
| 2013 | $2,292 +4.2% | $223,800 +0.2% |
| 2012 | $2,200 +3.7% | $223,300 -1.2% |
| 2011 | $2,121 +3.8% | $226,100 0% |
| 2010 | $2,043 -6.8% | $226,200 -17.7% |
| 2009 | $2,192 -6.5% | $274,700 -10.8% |
| 2008 | $2,345 +20.6% | $308,100 +0.2% |
| 2007 | $1,944 +8.8% | $307,600 +8.7% |
| 2006 | $1,786 +2.2% | $283,100 -1.9% |
| 2005 | $1,747 +15.1% | $288,700 +113.4% |
| 2004 | $1,518 | $135,300 |
| 2003 | $1,518 +24.8% | $135,300 |
| 2001 | $1,216 -3% | $135,300 +38.1% |
| 2000 | $1,254 | $98,000 |
Find assessor info on the county website
Monthly payment
Est. payment
Payment breakdown
Explore the cost of this home by adjusting the details. Changes won't be saved.Climate risks
Neighborhood: Marstons Mills
- $546,6003 bd1 ba1.2k sqft110 Raspberry Ln, Marstons Mills, MA 02648Off Market

- $542,1003 bd1 ba1k sqft93 Blueberry Ln, Marstons Mills, MA 02648Off Market
- $584,0002 bd2 ba1.3k sqft110 Blueberry Ln, Marstons Mills, MA 02648Off Market
- $602,0002 bd2 ba1.2k sqft100 Raspberry Ln, Marstons Mills, MA 02648Off Market
Similar homes
- $619,0003 bd3 ba1.1k sqft37 Huckleberry Lane, Marstons Mills, MA 02648For Sale
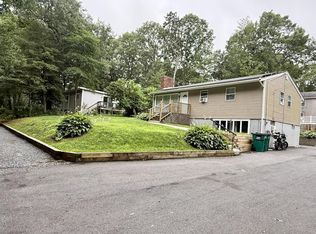
 MLS ID #22603720, Maiza F Eloy, Today Real Estate. CCIMLS
- $699,9003 bd3 ba1.3k sqft52 Willimantic Drive, Marstons Mills, MA 02648For Sale
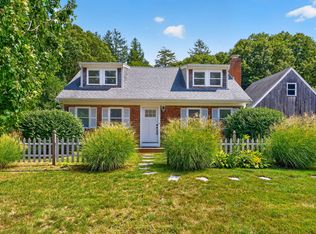 MLS ID #22604317, Tori Harrison Farr, Sotheby's International Realty, Inc.. CCIMLS
- $520,0002 bd1 ba976 sqft25 Raspberry Lane, Marstons Mills, MA 02648For Sale
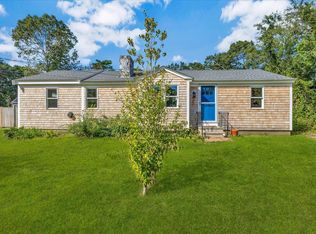 MLS ID #22604660, Bryony Scudder, Today Real Estate. CCIMLS
- $695,0003 bd3 ba2.1k sqft9 Debbies Ln, Marstons Mills, MA 02648For Sale
 MLS ID #73528427, LeAnn Bradbury, Coldwell Banker Realty - Scituate. MLS PIN
- $750,0003 bd3 ba1.6k sqft34 Commodore Lane, Marstons Mills, MA 02648For SaleMLS ID #22604232, Tiffany Callahan, Greer Real Estate, LLC. CCIMLS
- $685,0003 bd2 ba1.8k sqft160 Lincoln Road, Hyannis, MA 02601For SaleMLS ID #22603530, James Andrea, Lamacchia Realty, Inc.. CCIMLS
- $649,0002 bd2 ba1.5k sqft61 White Oak Trail, Centerville, MA 02632For SaleMLS ID #22603789, The Sampson and Stuart Team, William Raveis Real Estate & Home Services. CCIMLS
- $649,0004 bd2 ba1.8k sqft15 Melissa Avenue, Mashpee, MA 02649For SaleMLS ID #22603695, Stacey L Ricci, Sotheby's International Realty, Inc.. CCIMLS
- $679,0003 bd3 ba1.1k sqft38 Captain Small Road, South Yarmouth, MA 02664For SaleMLS ID #22605280, Tori Harrison Farr, Sotheby's International Realty, Inc.. CCIMLS
- $650,0003 bd2 ba1.6k sqft16 Pine View Drive, Cotuit, MA 02635For SaleMLS ID #22603078, Corinne J Costanzo, Berkshire Hathaway HomeServices Robert Paul Properties. CCIMLS
- $634,9002 bd2 ba1k sqft55 Seth Goodspeed Way, Osterville, MA 02655For SaleMLS ID #22601981, Donna Christopher, Sotheby's International Realty. CCIMLS
- $719,0004 bd2 ba1.5k sqft4 Kalmia Path, Sandwich, MA 02563For SaleMLS ID #22603933, The Cape House Team, William Raveis Real Estate & Home Services. CCIMLS
- $795,0003 bd2 ba1.3k sqft35 Pequot Road, Mashpee, MA 02649For SaleMLS ID #22604858, Brian G Cobb, CRS, Kinlin Grover Compass. CCIMLS
- $649,0003 bd2 ba1.3k sqft2 Mohegan Lane, Yarmouth Port, MA 02675For SaleMLS ID #22605035, The Cape House Team, William Raveis Real Estate & Home Services. CCIMLS
- $589,9002 bd2 ba1.3k sqft29 Race Lane, Sandwich, MA 02563For SaleMLS ID #22604379, Erin Cameron, William Raveis Real Estate & Home Services. CCIMLS
