$350,000
3 bd|2 ba|2k sqft
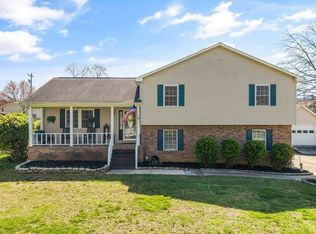
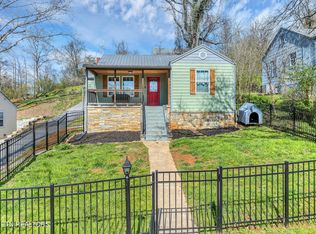
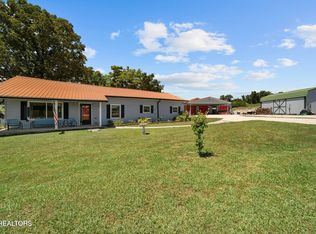
1016 Swan Pond Circle Rd, Harriman, TN 37748
Sold
Zillow last checked:
Listing updated:
Ashley Kitts,
Southern Homes Realty, LLC 865-457-2008
Not available
Estimated sales range
Not available
Not available
| Date | Event | Price |
|---|---|---|
| 6/9/2026 | Pending sale | $274,900$200/sqft |
Source: | ||
| 6/6/2026 | Price change | $274,900-4.9%$200/sqft |
Source: | ||
| 5/24/2026 | Pending sale | $289,000$210/sqft |
Source: | ||
| 5/17/2026 | Listed for sale | $289,000$210/sqft |
Source: | ||
| 5/12/2026 | Pending sale | $289,000$210/sqft |
Source: | ||
| 5/6/2026 | Listed for sale | $289,000+64.2%$210/sqft |
Source: | ||
| 11/6/2020 | Sold | $176,000+15.4%$128/sqft |
Source: | ||
| 7/31/2017 | Sold | $152,500-4.7%$111/sqft |
Source: | ||
| 7/6/2017 | Pending sale | $160,000$116/sqft |
Source: Coldwell Banker Wallace and Wallace Realtors #1007069 Report a problem | ||
| 6/19/2017 | Listed for sale | $160,000-4.2%$116/sqft |
Source: Coldwell Banker Wallace & Wallace, Realtors #1007069 Report a problem | ||
| 8/1/2010 | Listing removed | $167,000$122/sqft |
Source: Visual Tour #675558 Report a problem | ||
| 5/5/2010 | Listed for sale | $167,000+11.3%$122/sqft |
Source: Visual Tour #675558 Report a problem | ||
| 11/25/2009 | Sold | $150,000-10.2%$109/sqft |
Source: Public Record Report a problem | ||
| 8/1/2009 | Listed for sale | $167,000+23.2%$122/sqft |
Source: Coldwell Banker Jim Henry & Associates #675558 Report a problem | ||
| 5/16/2007 | Sold | $135,500+59.4%$99/sqft |
Source: Public Record Report a problem | ||
| 6/3/1998 | Sold | $85,000$62/sqft |
Source: Public Record Report a problem | ||
| Year | Property taxes | Tax assessment |
|---|---|---|
| 2025 | $892 +3.2% | $59,550 +65.2% |
| 2024 | $865 | $36,050 |
| 2023 | $865 | $36,050 |
| 2022 | $865 -2.8% | $36,050 |
| 2021 | $890 -0.3% | $36,050 -0.3% |
| 2020 | $893 +5.6% | $36,150 +14.8% |
| 2019 | $846 +4.3% | $31,500 |
| 2018 | $811 +0% | $31,500 |
| 2017 | $811 | $31,500 |
| 2016 | $811 | $31,500 |
| 2015 | $811 | $31,500 -2.5% |
| 2013 | $811 | $32,300 |
| 2011 | -- | $32,300 |
| 2010 | $708 | $32,300 |
| 2009 | -- | $32,300 +24.6% |
| 2008 | $682 | $25,925 |
| 2007 | $682 +10.5% | $25,925 |
| 2006 | $617 | $25,925 |
| 2005 | $617 -18.1% | $25,925 |
| 2004 | $753 +12.8% | $25,925 +12.8% |
| 2003 | $667 | $22,975 +6.7% |
| 2001 | -- | $21,532 -75% |
| 2000 | -- | $86,127 |
Find assessor info on the county website
A local agent can set up tours, give advice and negotiate with sellers.
A local lender can help you make sure your offer is ready when you are.