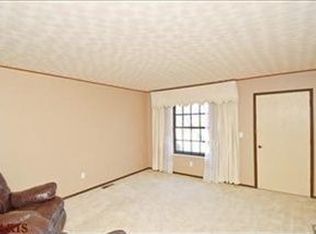
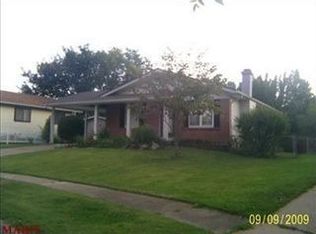
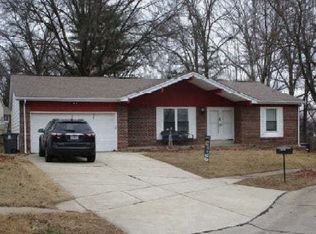
Welcome to an excellent investment opportunity in the heart of Florissant. This 3-bedroom, 1.5-bathroom home boasts 1,042 sq ft of living space, making it an attractive prospect for savvy investors. Don't miss out on this fantastic opportunity to add a cash-flowing property to your portfolio. A cozy yet spacious home with a thoughtful layout. Enjoy modern living with recent upgrades. The generously sized eat-in kitchen is a standout feature, offering ample space for culinary endeavors. A well-maintained and clean basement adds to the overall appeal of the property. Covered carport and fenced yard. Tenant in Place: The property is currently rented until 5/31/2027, providing an immediate income stream.
Active
Listed by: STL Smart Realty • Igal Alon • 314-292-9080
$149,900
1114 Ransome Ct, Florissant, MO 63031
3beds
1,042sqft
Single Family Residence
Built in 1976
6,359 Square Feet Lot
$148,400 Zestimate®
$144/sqft
$-- HOA
What's special
Fenced yardWell-maintained and clean basementCovered carportGenerously sized eat-in kitchenCozy yet spacious homeRecent upgradesThoughtful layout
- 42 days
- 560
- 68
Likely to sell faster than
Zillow last checked:
Listing updated:
Listed by:
Igal Alon 314-292-9080,
STL Smart Realty
Source: MARIS,MLS#: 26058074 Originating MLS: St. Louis Association of REALTORS
Facts & features
Interior
Bedrooms & bathrooms
- Bedrooms: 3
- Bathrooms: 2
- Full bathrooms: 1
- 1/2 bathrooms: 1
- Main level bathrooms: 2
- Main level bedrooms: 3
Primary bedroom
- Level: Main
- Area: 168
- Dimensions: 14x12
Bedroom
- Level: Main
- Area: 130
- Dimensions: 13x10
Bedroom
- Level: Main
- Area: 100
- Dimensions: 10x10
Kitchen
- Level: Main
- Area: 216
- Dimensions: 18x12
Living room
- Level: Main
- Area: 224
- Dimensions: 16x14
Heating
- Forced Air, Natural Gas
Cooling
- Ceiling Fan(s), Central Air, Electric
Appliances
- Included: Gas Water Heater
Features
- Special Millwork, Eat-in Kitchen
- Basement: Full,Concrete
- Has fireplace: No
- Fireplace features: None
Interior area
- Total structure area: 1,042
- Total interior livable area: 1,042 sqft
- Finished area above ground: 1,042
Property
Parking
- Total spaces: 1
- Parking features: Covered, Off Street
- Carport spaces: 1
Features
- Levels: One
- Patio & porch: Covered
Lot
- Size: 6,359 Square Feet
- Dimensions: 53 x 120
- Features: Adjoins Common Ground, Cul-De-Sac, Level
Details
- Parcel number: 05J220356
- Special conditions: Standard
Construction
Type & style
- Home type: SingleFamily
- Architectural style: Traditional,Ranch
- Property subtype: Single Family Residence
Materials
- Stone Veneer, Brick Veneer, Frame
Condition
- Year built: 1976
Utilities & green energy
- Electric: Ameren
- Sewer: Public Sewer
- Water: Public
- Utilities for property: Electricity Connected, Natural Gas Connected, Sewer Connected, Water Connected
Community & HOA
Community
- Subdivision: Wellington Chase 04 Sec 01
HOA
- Has HOA: No
Location
- Region: Florissant
Financial & listing details
- Price per square foot: $144/sqft
- Tax assessed value: $145,300
- Annual tax amount: $2,365
- Date on market: 9/15/2026
- Cumulative days on market: 42 days
- Listing terms: Cash,Conventional,FHA,VA Loan
- Ownership: Private
- Electric utility on property: Yes
- Road surface type: Concrete
Estimated market value
$148,400
$141,000 - $156,000
$1,597/mo
Price history
| Date | Event | Price |
|---|---|---|
| 9/15/2026 | Listed for sale | $149,900-12.3%$144/sqft |
Source:  MARIS #26058074 Report a problem | ||
| 4/16/2026 | Listing removed | $1,799$2/sqft |
Source: Zillow Rentals Report a problem | ||
| 4/10/2026 | Listed for rent | $1,799+79.9%$2/sqft |
Source: Zillow Rentals Report a problem | ||
| 12/2/2025 | Listing removed | $171,000$164/sqft |
Source: MARIS #24029157 Report a problem | ||
| 7/1/2025 | Listed for sale | $171,000$164/sqft |
Source: MARIS #24029157 Report a problem | ||
| 6/1/2025 | Listing removed | $171,000$164/sqft |
Source: MARIS #24029157 Report a problem | ||
| 11/7/2024 | Listed for sale | $171,000$164/sqft |
Source: MARIS #24029157 Report a problem | ||
| 5/29/2024 | Listing removed | $171,000$164/sqft |
Source: MARIS #24029157 Report a problem | ||
| 5/12/2024 | Listed for sale | $171,000+500%$164/sqft |
Source: MARIS #24029157 Report a problem | ||
| 1/1/2013 | Listing removed | $1,000$1/sqft |
Source: New Vision group llc. Report a problem | ||
| 8/28/2012 | Listed for rent | $1,000$1/sqft |
Source: New Vision group llc. Report a problem | ||
| 7/26/2012 | Sold | -- |
Source: MARIS #12003409 Report a problem | ||
| 3/21/2012 | Listing removed | $28,500$27/sqft |
Source: American Realty Group #12003409 Report a problem | ||
| 1/22/2012 | Listed for sale | $28,500$27/sqft |
Source: American Realty Group #12003409 Report a problem | ||
| 1/10/2012 | Sold | -- |
Source: Public Record Report a problem | ||
| 7/7/2000 | Sold | -- |
Source: Public Record Report a problem | ||
Public tax history
| Year | Property taxes | Tax assessment |
|---|---|---|
| 2025 | $2,365 +4.9% | $27,610 +7.2% |
| 2024 | $2,255 +0.1% | $25,750 |
| 2023 | $2,252 +16.7% | $25,750 +31.2% |
| 2022 | $1,930 +1.4% | $19,630 |
| 2021 | $1,902 +4.8% | $19,630 +12.6% |
| 2020 | $1,815 +4.4% | $17,430 |
| 2019 | $1,738 | $17,430 +11.9% |
| 2018 | $1,738 | $15,580 |
| 2017 | $1,738 +0.1% | $15,580 -0.3% |
| 2016 | $1,736 -1.6% | $15,620 |
| 2015 | $1,764 | $15,620 +3.5% |
| 2014 | $1,764 +8.9% | $15,090 |
| 2013 | $1,620 | $15,090 -7.6% |
| 2012 | -- | $16,340 |
| 2011 | -- | $16,340 -20.2% |
| 2010 | $2,039 +6.1% | $20,480 |
| 2009 | $1,921 +1% | $20,480 -8.3% |
| 2008 | $1,902 +18.2% | $22,330 |
| 2007 | $1,609 | $22,330 +24.9% |
| 2006 | $1,609 +2.4% | $17,880 |
| 2005 | $1,571 +48.2% | $17,880 +24.2% |
| 2003 | $1,061 +4.8% | $14,400 +13.9% |
| 2002 | $1,012 +9.4% | $12,640 |
| 2001 | $926 | $12,640 |
Find assessor info on the county website
Monthly payment
Est. payment
Payment breakdown
Explore the cost of this home by adjusting the details. Changes won't be saved.Climate risks
Neighborhood: 63031
Nearby schools
Schools provided by the listing agent
- Elementary: Brown Elem.
- Middle: Central Middle
- High: Hazelwood Central High
Source: MARIS. This data may not be complete. We recommend contacting the local school district to confirm school assignments for this home.
Similar homes
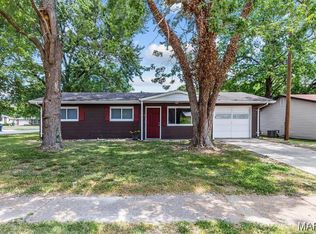
- $149,0003 bd2 ba1.1k sqft1395 Bluebird Dr, Florissant, MO 63031For Sale
 MLS ID #26063484, Igal Alon, STL Smart Realty. MARIS
- $144,9003 bd1 ba864 sqft145 Clearview Dr, Florissant, MO 63033For Sale
 MLS ID #26055698, Brandon L Barbier, Full Scope Home Services, Inc.. MARIS
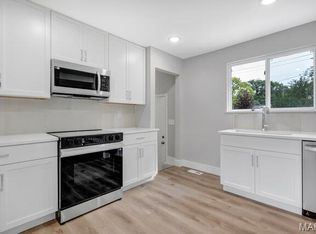
- $159,9003 bd1 ba1.1k sqft855 Northmoor Dr, Florissant, MO 63033For Sale
 MLS ID #26060274, Bryan Jones, Real Broker LLC. MARIS
- $--3 bd2 ba1.4k sqft6787 Lesli Mari Ct, Florissant, MO 63033Auction
 Auction.com 1
- $142,0003 bd2 ba1.1k sqft705 Palace Ct, Saint Louis, MO 63135For SaleMLS ID #26058151, April K Minner, TimberVine Group. MARIS
- $195,0003 bd2 ba978 sqft13 Sunridge Ln, Florissant, MO 63031For SaleMLS ID #26034426, Jamie Speckhard, The Hermann London Group LLC. MARIS
- $99,9003 bd1 ba927 sqft95 Florissant Park Dr, Florissant, MO 63031For SaleMLS ID #26004874, Blake W Rasmussen, Vylla Home. MARIS
- $160,0004 bd3 ba1.3k sqft6144 Evergreen Blvd, Saint Louis, MO 63134For SaleMLS ID #26066989, Phillip Patton, United Realty Co.. MARIS
- $159,9003 bd1 ba1k sqft11258 Saint Damian Dr, Saint Ann, MO 63074For SaleMLS ID #26067545, Steven F Studnicki, Coldwell Banker Realty - Gundaker. MARIS
- $178,0003 bd2 ba1.4k sqft4421 Rhine Dr, Florissant, MO 63033For SaleMLS ID #26058288, Jie Shen, Shenstone Realty Inc.. MARIS
- $120,0003 bd1 ba1k sqft2212 Collett Dr, Saint Louis, MO 63136For SaleMLS ID #26068004, Alicia L Johnson, Coldwell Banker Premier Group. MARIS
- $125,0002 bd2 ba1.2k sqft3701 Candlewyck Club Dr APT A, Florissant, MO 63034For SaleMLS ID #26055003, Dallas Jones, Nettwork Global. MARIS
- $199,9003 bd2 ba1.4k sqft2640 Suffolk Pl, Florissant, MO 63033For SaleMLS ID #26045147, Robert Salmons, Entera Realty, LLC. MARIS
- $179,8003 bd2 ba1.3k sqft12075 Nero Dr, Florissant, MO 63033For SaleMLS ID #26027181, Wei Liu, WT Realty. MARIS
- $92,0002 bd2 ba868 sqft2049 New Sun Dr, Florissant, MO 63031For SaleMLS ID #26060644, Deairra L Freeman, Keller Williams Realty St. Louis. MARIS
- $125,0003 bd1 ba1.4k sqft19 S Schlueter Ave, Saint Louis, MO 63135For SaleMLS ID #26058168, Josh J Cox, The Closing Pros LLC. MARIS
- $190,0003 bd2 ba1k sqft7416 Foxmont Dr, Hazelwood, MO 63042For SaleMLS ID #26045078, John M Smelser, ReeceNichols Real Estate. MARIS
- $155,0003 bd1 ba1.2k sqft11021 Saint Girard Ln, Saint Ann, MO 63074For SaleMLS ID #26029688, Debbie J Williams, ReeceNichols Real Estate. MARIS
- $125,0003 bd1 ba1.5k sqft118 Paul Ave, Saint Louis, MO 63135For SaleMLS ID #26066650, Amy L Prusinowski, RE/MAX Results. MARIS
