Welcome to this charming 3-bedroom, 1.5-bath home located in the Greenvalley Heights neighborhood! This well-maintained property sits on a beautifully landscaped lot featuring a fenced-in backyard, perfect for pets, play, or entertaining. Enjoy outdoor living on the covered front porch or relax on the rear patio overlooking the yard. Inside, you'll find comfortable living spaces filled with natural light and plenty of potential to make it your own. The unfinished walkout basement offers endless possibilities for additional living space, storage, or a workshop. Conveniently located near schools, shopping, and parks, this home combines comfort, functionality, and an ideal location. Sq. ft. & rm. sz. are approximate; if critical, buyers should verify.
Pending
Price cut: $36.5K (10/5)
$265,500
112 Cheryl Dr, New Albany, IN 47150
3beds
1,161sqft
Single Family Residence
Built in 1963
0.4 Acres Lot
$222,900 Zestimate®
$229/sqft
$-- HOA
What's special
- 368 days
- 547
- 41
Zillow last checked:
Listed by:
Stephannie Wilson,
NextHome Wilson Real Estate Services
Source: NextHome,MLS#: 2025012170
Facts & features
Interior
Bedrooms & bathrooms
- Bedrooms: 3
- Bathrooms: 2
- Full bathrooms: 1
- 1/2 bathrooms: 1
Features
- Has basement: No
Interior area
- Total structure area: 1,161
- Total interior livable area: 1,161 sqft
Video & virtual tour
Property
Lot
- Size: 0.4 Acres
Details
- Parcel number: 220501500298000008
Construction
Type & style
- Home type: SingleFamily
- Property subtype: Single Family Residence
Condition
- Year built: 1963
Community & HOA
Location
- Region: New Albany
Financial & listing details
- Price per square foot: $229/sqft
- Tax assessed value: $133,100
- Annual tax amount: $1,118
- Date on market: 11/7/2025
- Lease term: Contact For Details
Estimated market value
$222,900
$212,000 - $234,000
$1,598/mo
Price history
| Date | Event | Price |
|---|---|---|
| 10/5/2026 | Price change | $229,000-13.7%$197/sqft |
Source:  SIRA #2026012311 Report a problem | ||
| 9/24/2026 | Pending sale | $265,500+15.9%$229/sqft |
Source:  NextHome #2025012170 Report a problem | ||
| 9/23/2026 | Price change | $229,000-4.5%$197/sqft |
Source: SIRA #202609853 Report a problem | ||
| 8/16/2026 | Price change | $239,900-2.1%$207/sqft |
Source: SIRA #202609853 Report a problem | ||
| 7/6/2026 | Price change | $245,000-1.8%$211/sqft |
Source: SIRA #202609853 Report a problem | ||
| 6/22/2026 | Price change | $249,500-3.3%$215/sqft |
Source: SIRA #202607148 Report a problem | ||
| 6/1/2026 | Price change | $258,000-1%$222/sqft |
Source: SIRA #202607148 Report a problem | ||
| 4/4/2026 | Price change | $260,500-1.9%$224/sqft |
Source: SIRA #202607148 Report a problem | ||
| 3/24/2026 | Price change | $265,500-1.1%$229/sqft |
Source: SIRA #2025012170 Report a problem | ||
| 2/19/2026 | Price change | $268,500-3.9%$231/sqft |
Source: SIRA #2025012170 Report a problem | ||
| 2/1/2026 | Price change | $279,500-3.6%$241/sqft |
Source: SIRA #2025012170 Report a problem | ||
| 11/7/2025 | Listed for sale | $289,900$250/sqft |
Source: SIRA #2025012170 Report a problem | ||
Public tax history
| Year | Property taxes | Tax assessment |
|---|---|---|
| 2025 | $1,118 +783% | $133,100 +15.2% |
| 2024 | $127 -40.1% | $115,500 -4.3% |
| 2023 | $211 +175.8% | $120,700 -0.9% |
| 2022 | $77 +3.6% | $121,800 +6.9% |
| 2021 | $74 -75.6% | $113,900 |
| 2020 | $303 +225.8% | $113,900 -9.3% |
| 2019 | $93 -40.6% | $125,600 +11.2% |
| 2018 | $156 | $112,900 -3.2% |
| 2017 | $156 -17.6% | $116,600 +0.9% |
| 2016 | $190 | $115,600 -1% |
| 2014 | $190 +15.9% | $116,800 -3.6% |
| 2013 | $164 -48.6% | $121,200 -1.1% |
| 2012 | $318 -86.7% | $122,500 +2% |
| 2011 | $2,402 +139.5% | $120,100 +7.2% |
| 2010 | $1,003 -55.2% | $112,000 |
| 2009 | $2,240 +295.1% | $112,000 -1.8% |
| 2007 | $567 | $114,100 +1.2% |
| 2006 | -- | $112,700 +39.3% |
| 2005 | -- | $80,900 |
Find assessor info on the county website
Monthly payment
Est. payment
Payment breakdown
Explore the cost of this home by adjusting the details. Changes won't be saved.Climate risks
Neighborhood: 47150


Similar homes
- $259,9003 bd2 ba1.7k sqft3312 Mellwood Drive, New Albany, IN 47150For Sale
 MLS ID #2026012309, Shelby Fryrear, Schuler Bauer Real Estate Services ERA Powered (N. SIRA
- $259,0003 bd1 ba1.4k sqft1812 Crestview Drive, New Albany, IN 47150For Sale
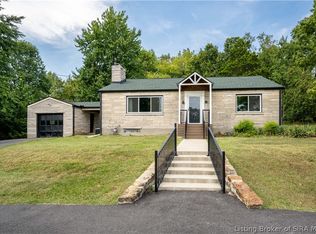 MLS ID #2026011661, Julie Knotts, Coldwell Banker McMahan. SIRA
- $250,0004 bd2 ba1.4k sqft313 Mary Drive, New Albany, IN 47150For Sale
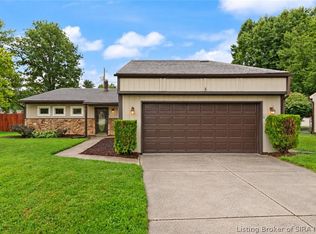 MLS ID #2026011059, Beth Romaine Ballard, Ward Realty Services. SIRA
- $245,0003 bd2 ba1.3k sqft2003 Cedar Ridge Drive, New Albany, IN 47150For Sale
 MLS ID #202609979, Justin Sewell, Collective Roots Agency. SIRA
