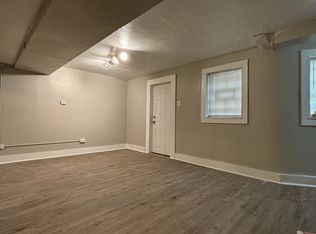
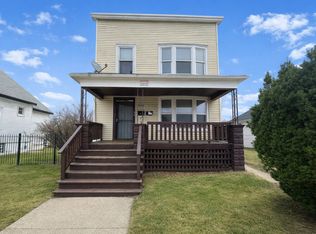
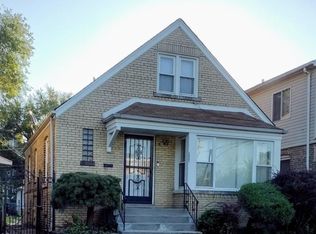
Income-producing 2-unit building. First-floor unit includes a finished lower-level mother-in-law suite and is currently rented for a combined $2,400/month. Second-floor unit is vacant and ready for an owner-occupant or investor looking to maximize cash flow (market rent approximately $1,200/month). Situated on an oversized corner lot near the future 111th Street Red Line Extension Station, offering strong potential for appreciation. Property sold AS IS. Proof of funds or lender pre-approval required prior to showing. Conventional financing or cash.
Active
$198,000
11201 S Normal Ave, Chicago, IL 60628
5beds
--sqft
Multi Family
Built in 1911
-- sqft lot
$197,000 Zestimate®
$--/sqft
$-- HOA
What's special
Finished lower-level mother-in-law suiteOversized corner lot
- 23 days |
- 427 |
- 58 |
Zillow last checked:
Listing updated:
Listed by:
Gabriel Jackson 312-915-0100,
Kale Realty
Source: MRED as distributed by MLS GRID,MLS#: 12658835
Loading...
Facts & features
Interior
Bedrooms & bathrooms
- Bedrooms: 5
- Bathrooms: 2
- Full bathrooms: 2
- 1/2 bathrooms: 1
Heating
- Natural Gas
Features
- Basement: Finished,Full
Property
Parking
- Total spaces: 3
- Parking features: Yes
Lot
- Size: 3,750 Square Feet
- Dimensions: 30 x 125
Details
- Parcel number: 25211140010000
- Special conditions: List Broker Must Accompany
Construction
Type & style
- Home type: MultiFamily
- Property subtype: Multi Family
Materials
- Vinyl Siding, Brick
Condition
- New construction: No
- Year built: 1911
- Major remodel year: 2023
Utilities & green energy
- Sewer: Public Sewer
- Water: Lake Michigan
Community & HOA
Location
- Region: Chicago
Financial & listing details
- Tax assessed value: $160,000
- Annual tax amount: $1,057
- Date on market: 6/1/2026
- Ownership: Fee Simple
Estimated market value
$197,000
$187,000 - $207,000
$1,841/mo
Price history
| Date | Event | Price |
|---|---|---|
| 6/1/2026 | Listed for sale | $198,000+4.2% |
Source: MRED as distributed by MLS GRID #12658835 Report a problem | ||
| 5/6/2026 | Listing removed | $190,000 |
Source: | ||
| 5/5/2026 | Listed for sale | $190,000 |
Source: | ||
| 3/24/2026 | Contingent | $190,000 |
Source: | ||
| 3/22/2026 | Listed for sale | $190,000-0.3% |
Source: | ||
| 2/10/2026 | Listing removed | $190,500 |
Source: | ||
| 2/9/2026 | Listed for sale | $190,500 |
Source: | ||
| 1/29/2026 | Contingent | $190,500 |
Source: | ||
| 12/27/2025 | Listed for sale | $190,500 |
Source: | ||
| 11/21/2025 | Contingent | $190,500 |
Source: | ||
| 11/14/2025 | Listed for sale | $190,500+35.1% |
Source: | ||
| 2/28/2025 | Sold | $141,000+76.3% |
Source: Public Record Report a problem | ||
| 9/5/2024 | Sold | $80,000+0.1% |
Source: | ||
| 8/13/2024 | Contingent | $79,900 |
Source: | ||
| 8/9/2024 | Listed for sale | $79,900 |
Source: | ||
| 8/5/2024 | Contingent | $79,900 |
Source: | ||
| 8/2/2024 | Listed for sale | $79,900-17.6% |
Source: | ||
| 7/7/2024 | Listing removed | -- |
Source: | ||
| 6/5/2024 | Listed for sale | $97,000 |
Source: | ||
| 5/21/2024 | Contingent | $97,000 |
Source: | ||
| 5/5/2024 | Listed for sale | $97,000 |
Source: | ||
| 4/19/2024 | Contingent | $97,000 |
Source: | ||
| 4/19/2024 | Listed for sale | $97,000 |
Source: | ||
| 4/12/2024 | Contingent | $97,000 |
Source: | ||
| 4/2/2024 | Price change | $97,000-22.4% |
Source: | ||
| 3/3/2024 | Price change | $125,000-10.7% |
Source: | ||
| 2/15/2024 | Listed for sale | $139,900 |
Source: | ||
Public tax history
| Year | Property taxes | Tax assessment |
|---|---|---|
| 2024 | -- | $16,000 +220.1% |
| 2023 | $1,057 +2.5% | $4,999 |
| 2022 | $1,031 +2.3% | $4,999 |
| 2021 | $1,008 -39.6% | $4,999 -33.1% |
| 2020 | $1,668 -1.3% | $7,468 -11% |
| 2019 | $1,690 +1.7% | $8,392 |
| 2018 | $1,662 -41.4% | $8,392 -36.1% |
| 2017 | $2,836 +7.5% | $13,143 |
| 2016 | $2,639 -2.1% | $13,143 -10.5% |
| 2015 | $2,697 +11.5% | $14,679 +12.9% |
| 2014 | $2,419 +25.1% | $13,004 +22.6% |
| 2013 | $1,934 -8.7% | $10,610 -9.9% |
| 2012 | $2,119 +2.6% | $11,780 -7.3% |
| 2011 | $2,065 -0.4% | $12,713 |
| 2010 | $2,073 -6% | $12,713 -9.9% |
| 2009 | $2,205 +8.9% | $14,111 +0.2% |
| 2008 | $2,024 -11.6% | $14,083 -12.6% |
| 2007 | $2,290 -1.1% | $16,106 |
| 2006 | $2,315 +56.1% | $16,106 +77.7% |
| 2005 | $1,483 +1% | $9,063 |
| 2004 | $1,469 -10.8% | $9,063 -12.7% |
| 2003 | $1,646 +16.4% | $10,380 +32% |
| 2002 | $1,414 +39.7% | $7,861 |
| 2001 | $1,013 +3% | $7,861 |
| 2000 | $983 | $7,861 +10.6% |
| 1999 | -- | $7,109 |
Find assessor info on the county website
Monthly payment
Est. payment$--/mo
Payment breakdown
Explore the cost of this home by adjusting the details. Changes won't be saved.All calculations are estimates and provided by Zillow, Inc. for informational purposes only. Actual amounts may vary.
HOA fees may include property taxes on listings classified as Co-Ops. Contact the listing agent and/or owner for fee details.
Mortgage interest rates are dependent on a number of factors, including credit score, down payment, and repayment length. Interest rate data provided by Zillow Group Marketplace, Inc. as of 1/1/1970 from various mortgage lenders with which we have lead or other similar arrangements; the Estimated Payment is an average of those rates.
See how much you could borrow to make a competitive offer.
Climate risks
Neighborhood: Roseland
Nearby schools
GreatSchools rating
- 3/10Haley Elementary AcademyGrades: PK-8Distance: 0.3 mi
- NAFenger Academy High SchoolGrades: 9-12Distance: 0.2 mi
Schools provided by the listing agent
- Elementary: Abbott Elementary School
- District: 299
Source: MRED as distributed by MLS GRID. This data may not be complete. We recommend contacting the local school district to confirm school assignments for this home.
A local agent can set up tours, give advice and negotiate with sellers.


- Illinois
- Cook County
- Chicago
- 60628
- Roseland
- 11201 S Normal Ave
Nearby cities
Nearby neighborhoods
Nearby zip codes
Other Chicago Topics
