Pool home with 4 bedroom 3 bath. Nice split plan with primary bedroom on one side and the other 3 on the other side with 2 of them sharing a bathroom and the other bedroom close to the 3rd bathroom which also opens to the pool area. Kitchen open to the living room which has a fireplace. Dining room open to front entrance. Mostly one dark grey tile throughout house, except in bathrooms, kitchen and primary bedroom. Plantation shutters. Vinyl fenced back yard. Screened pool. Pool is easy to care for. Shed in back yard. AC replaced 3 years ago. Original roof with no leaks.
For sale by owner
Price cut: $10K (11/1)
$439,000
119 Sea Trl, Palm Coast, FL 32164
4beds
2,030sqft
SingleFamily
Built in 2005
10,001 Square Feet Lot
$-- Zestimate®
$216/sqft
$-- HOA
What's special
Screened poolPlantation shutters
- 25 days
- 787
- 55
Listed by:
Property Owner (386) 320-9250
Facts & features
Interior
Bedrooms & bathrooms
- Bedrooms: 4
- Bathrooms: 3
- Full bathrooms: 3
Heating
- Forced air
Cooling
- Central
Appliances
- Included: Dishwasher, Garbage disposal, Microwave, Range / Oven
Features
- Flooring: Softwood, Tile
- Has fireplace: Yes
Interior area
- Total interior livable area: 2,030 sqft
Property
Parking
- Total spaces: 6
- Parking features: Garage
Features
- Exterior features: Stucco
Lot
- Size: 10,001 Square Feet
Details
- Parcel number: 0711317059003200030
Construction
Type & style
- Home type: SingleFamily
Materials
- Roof: Asphalt
Condition
- New construction: No
- Year built: 2005
Utilities & green energy
- Sewer: City
Community & HOA
Location
- Region: Palm Coast
Financial & listing details
- Price per square foot: $216/sqft
- Tax assessed value: $299,429
- Annual tax amount: $3,522
- Date on market: 10/10/2026
Estimated market value
Not available
Estimated sales range
Not available
$2,392/mo
Price history
| Date | Event | Price |
|---|---|---|
| 11/1/2026 | Price change | $439,000-2.2%$216/sqft |
Source: Owner Report a problem | ||
| 10/10/2026 | Listed for sale | $449,000-7.2%$221/sqft |
Source: Owner Report a problem | ||
| 2/27/2024 | Listing removed | -- |
Source:  Stellar MLS #FC294145 Report a problem | ||
| 8/29/2023 | Price change | $484,000-2.2%$238/sqft |
Source: Stellar MLS #FC294145 Report a problem | ||
| 8/1/2023 | Price change | $495,000-3.9%$244/sqft |
Source: Owner Report a problem | ||
| 7/24/2023 | Listed for sale | $515,000+106%$254/sqft |
Source: Owner Report a problem | ||
| 1/17/2020 | Sold | $250,000-5.3%$123/sqft |
Source:  DBAMLS #1064830 Report a problem | ||
| 12/10/2019 | Price change | $263,900-2.2%$130/sqft |
Source: TRADEMARK REALTY GROUP LLC #252768 Report a problem | ||
| 11/13/2019 | Listed for sale | $269,900+62%$133/sqft |
Source: TRADEMARK REALTY GROUP LLC #252768 Report a problem | ||
| 6/17/2005 | Sold | $166,600+580%$82/sqft |
Source: Public Record Report a problem | ||
| 10/17/2003 | Sold | $24,500+260.3%$12/sqft |
Source: Public Record Report a problem | ||
| 5/2/2002 | Sold | $6,800$3/sqft |
Source: Public Record Report a problem | ||
Public tax history
| Year | Property taxes | Tax assessment |
|---|---|---|
| 2025 | $3,522 +2.5% | $236,923 +2.9% |
| 2024 | $3,437 +2.6% | $230,246 +3% |
| 2023 | $3,350 +1% | $223,540 +3% |
| 2022 | $3,317 +1.3% | $217,029 +3% |
| 2021 | $3,275 +68.6% | $210,708 +44.7% |
| 2020 | $1,943 +2.1% | $145,610 +2.3% |
| 2019 | $1,902 +0.9% | $142,336 +1.9% |
| 2018 | $1,886 +2.8% | $139,682 +2.1% |
| 2017 | $1,834 | $136,809 +2.1% |
| 2016 | $1,834 +2.8% | $133,995 +0.7% |
| 2015 | $1,784 0% | $133,064 +0.8% |
| 2014 | $1,785 | $132,008 +1.5% |
| 2013 | -- | $130,057 +1.7% |
| 2012 | -- | $127,883 -4.1% |
| 2011 | -- | $133,282 -14.4% |
| 2010 | -- | $155,678 -7.3% |
| 2009 | -- | $167,909 -6.1% |
| 2008 | -- | $178,780 -6.3% |
| 2007 | -- | $190,811 +2.5% |
| 2006 | -- | $186,157 +474.6% |
| 2005 | -- | $32,400 +109% |
| 2004 | -- | $15,500 |
Find assessor info on the county website
Monthly payment
Est. payment
Payment breakdown
Explore the cost of this home by adjusting the details. Changes won't be saved.Climate risks
Neighborhood: 32164


Similar homes
- $--5 bd3 ba2.4k sqft44 Sleepy Hollow Trl, Palm Coast, FL 32164Auction
 Auction.com 2
- $480,0004 bd3 ba2.2k sqft3 SEA BOARD Court, Palm Coast, FL 32164For Sale
 MLS ID #2100336, RAMONA DAMIAN. realMLS
- $477,9003 bd2 ba2.2k sqft1 Sea Front Trl, Palm Coast, FL 32164New Construction
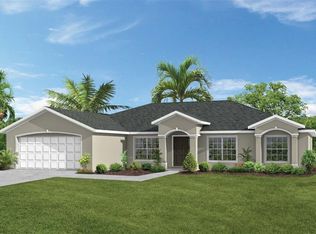
 MLS ID #1229702, Tommie Krawiec, SeaGate Real Estate Inc.. DBAMLS
- $349,0004 bd2 ba2.2k sqft18 SMITH TRAIL, PALM COAST, FL 32164For Sale
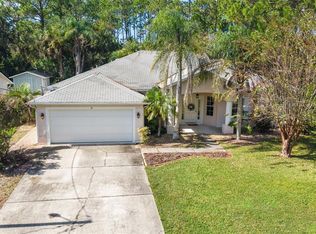
 MLS ID #A4711260, Scott Fader, JOSEPH WALTER REALTY LLC. Stellar MLS
- $449,0003 bd2 ba1.9k sqft1 SLIPPER FLOWER PATH E, PALM COAST, FL 32164For SaleMLS ID #FC319564, Christeen Haney, FLORIDA HOMES REALTY & MORTGAGE. Stellar MLS
- $400,0003 bd2 ba1.8k sqft19 SECKEL COURT, PALM COAST, FL 32137For SaleMLS ID #FC321877, Jorge Santos, COLDWELL BANKER PREMIER PROPERTIES. Stellar MLS
- $488,9005 bd4 ba3k sqft91 SEA TRAIL, PALM COAST, FL 32164For SaleMLS ID #FC310800, Larissa Johnson, 1ST GLOBAL REALTY, LLC. Stellar MLS
- $399,5004 bd2 ba2.2k sqft16 SEVEN CHAMPIONS PATH N, PALM COAST, FL 32164For SaleMLS ID #FC320501, Maria Tilton, BERKSHIRE HATHAWAY HOMESERVICE (OCEANSHORE). Stellar MLS
- $459,9004 bd3 ba2.3k sqft90 UNIVERSIAL TRAIL, PALM COAST, FL 32164For SaleMLS ID #FC317735, Merle Spencer, FLAGLER REALTY PROFESSIONALS LLC. Stellar MLS
- $325,0004 bd2 ba1.7k sqft34 Seathorn Path, Palm Coast, FL 32164For SaleMLS ID #1232039, Mike Gagliardi, RE/MAX Signature. DBAMLS
- $427,9004 bd3 ba2.3k sqft5 SERVICE BERRY PLACE, PALM COAST, FL 32164New ConstructionStellar MLS
- $449,9006 bd4 ba2.4k sqft8 Slatington Pl #A & B, Palm Coast, FL 32164For SaleMLS ID #1230918, Michael Lockhart, Oceans Luxury Realty Full Service LLC. DBAMLS
- $335,9903 bd2 ba1.5k sqft134 SEA TRAIL, PALM COAST, FL 32164New ConstructionStellar MLS
- $374,9004 bd2 ba1.7k sqft106 N Coopers Hawk Ct, Palm Coast, FL 32164For SaleMLS ID #1232305, Viktoriia Prytula, Real Broker, LLC. DBAMLS
- $539,9003 bd2 ba2k sqft12 SELKIRK PLACE, PALM COAST, FL 32164For SaleMLS ID #FC321902, Usama Farahat, THE REAL GATOR REALTY LLC. Stellar MLS
- $409,9004 bd3 ba2.3k sqft7 SERVICE BERRY PLACE, PALM COAST, FL 32164New ConstructionStellar MLS
- $564,9006 bd4 ba2.5k sqft112 Seattle Trl, Palm Coast, FL 32164New ConstructionMLS ID #1229701, Tommie Krawiec, SeaGate Real Estate Inc.. DBAMLS
- $335,9903 bd2 ba1.5k sqft3 SLEEPING BEAUTY PLACE, PALM COAST, FL 32164New ConstructionStellar MLS
