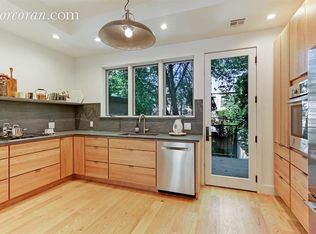
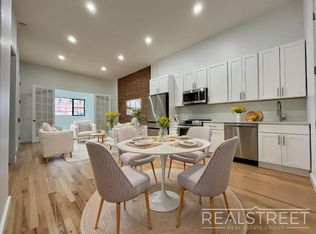
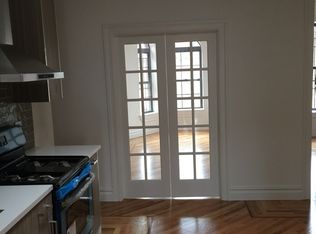
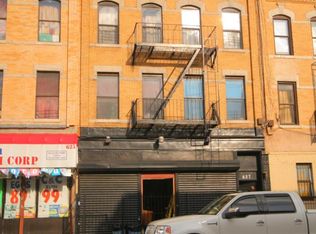
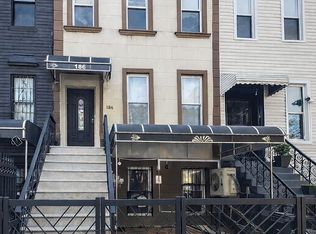
Well-maintained three-family home built in 2006 with strong income potential. Each floor features a 3-bedroom, 2-bathroom apartment. The first floor currently rents for $3,800, the second floor for $3,600, and the third floor for $3,000. The property also includes a full finished basement, offering additional usable space. An excellent opportunity for investors or owner-occupants seeking a modern multi-family property with consistent rental income. All information provided is deemed reliable but not guaranteed and should be independently verified.
Active
Price cut: $35K (4/24)
$1,649,000
1198 Decatur St, Brooklyn, NY 11207
9beds
2,000sqft
Multi Family
Built in 2006
-- sqft lot
$1,546,800 Zestimate®
$825/sqft
$-- HOA
What's special
Full finished basement
- 119 days |
- 98 |
- 0 |
Zillow last checked:
Listing updated:
Listed by:
Keller Williams Realty Landmark II 347-968-6288,
Silvia Corrales
Source: StreetEasy,MLS#: S1811327
Loading...
Facts & features
Interior
Bedrooms & bathrooms
- Bedrooms: 9
- Bathrooms: 6
- Full bathrooms: 6
Features
- Flooring: Hardwood
Interior area
- Total structure area: 2,000
- Total interior livable area: 2,000 sqft
Property
Details
- Parcel number: 034350012
- Special conditions: Resale
Construction
Type & style
- Home type: MultiFamily
- Property subtype: Multi Family
Condition
- Year built: 2006
Community & HOA
Community
- Subdivision: Bushwick
Location
- Region: Brooklyn
Financial & listing details
- Price per square foot: $825/sqft
- Tax assessed value: $1,277,000
- Annual tax amount: $9,456
- Date on market: 2/17/2026
Estimated market value
$1,546,800
$1.47M - $1.62M
$4,137/mo
Price history
| Date | Event | Price |
|---|---|---|
| 4/24/2026 | Price change | $1,599,000-2.1%$800/sqft |
Source: | ||
| 3/17/2026 | Price change | $1,634,000-0.9%$817/sqft |
Source: | ||
| 2/17/2026 | Listed for sale | $1,649,000$825/sqft |
Source: StreetEasy #S1811327 Report a problem | ||
| 2/17/2026 | Contingent | $1,649,000$825/sqft |
Source: StreetEasy #S1811327 Report a problem | ||
| 2/3/2026 | Listed for sale | $1,649,000+0.9%$825/sqft |
Source: | ||
| 12/9/2024 | Sold | $1,635,000+25.8%$818/sqft |
Source: Public Record Report a problem | ||
| 10/12/2022 | Listing removed | -- |
Source: | ||
| 9/17/2022 | Listed for sale | $1,300,000+19.8%$650/sqft |
Source: | ||
| 11/2/2016 | Sold | $1,085,000-1.2%$543/sqft |
Source: Public Record Report a problem | ||
| 4/6/2016 | Price change | $1,098,000-8.1%$549/sqft |
Source: CENTURY 21 Homefront #DC1198D Report a problem | ||
| 1/23/2016 | Price change | $1,195,000-0.4%$598/sqft |
Source: Century 21 Homefront Realty #398590 Report a problem | ||
| 12/3/2015 | Price change | $1,199,900-4%$600/sqft |
Source: Better Homes and Gardens Real Estate Amiable II #1198 Report a problem | ||
| 9/30/2015 | Listed for sale | $1,250,000+681.3%$625/sqft |
Source: CENTURY 21 Amiable II #1198 Report a problem | ||
| 8/3/2005 | Sold | $160,000$80/sqft |
Source: Public Record Report a problem | ||
Public tax history
| Year | Property taxes | Tax assessment |
|---|---|---|
| 2025 | $9,577 +4.7% | $76,620 +4.6% |
| 2024 | $9,145 | $73,260 +11.3% |
| 2023 | -- | $65,820 -6.1% |
| 2022 | -- | $70,080 +10.4% |
| 2021 | -- | $63,480 +7.6% |
| 2020 | $8,513 +6% | $58,980 +14.6% |
| 2019 | $8,032 +4.6% | $51,480 +40.2% |
| 2018 | $7,681 +6.8% | $36,720 +4.1% |
| 2017 | $7,192 +4.2% | $35,280 |
| 2016 | $6,899 | $35,280 +5.3% |
| 2015 | $6,899 +71.9% | $33,517 +6% |
| 2014 | $4,014 | $31,620 +3.3% |
| 2013 | -- | $30,600 +4.1% |
| 2012 | -- | $29,400 -15.1% |
| 2011 | -- | $34,620 -17.6% |
| 2010 | -- | $42,000 +35.2% |
| 2009 | -- | $31,074 +0.3% |
| 2008 | -- | $30,982 +17.3% |
| 2007 | -- | $26,408 |
Find assessor info on the county website
Monthly payment
Estimated monthly payment$1,822
All calculations are estimates and provided by Zillow, Inc. for informational purposes only. Actual amounts may vary.
HOA fees may include property taxes on listings classified as Co-Ops. Contact the listing agent and/or owner for fee details.
Mortgage interest rates are dependent on a number of factors, including credit score, down payment, and repayment length. Interest rate data provided by Zillow Group Marketplace, Inc. as of 1/1/1970 from various mortgage lenders with which we have lead or other similar arrangements; the Estimated Payment is an average of those rates.
See how much you could borrow to make a competitive offer.
Climate risks
Neighborhood: East New York
Nearby schools
GreatSchools rating
- 9/10Ps 149 Danny KayeGrades: PK-5Distance: 0.1 mi
- 5/10Jhs 292 Margaret S DouglasGrades: 6-8Distance: 0.1 mi
- NABARD HIGH SCHOOL EARLY COLLEGE BROOKLYNGrades: 9,11Distance: 0.1 mi
A local agent can set up tours, give advice and negotiate with sellers.


- New York
- Kings County
- New York
- 11207
- Brooklyn
- East New York
- 1198 Decatur St
Nearby cities
Nearby neighborhoods
Nearby zip codes
Other New York Topics
