A rare Santa Barbara opportunity featuring two fully detached residences on one property, offering approximately 2,429 total SqFt between the two homes. Each residence offers 3BD/2BA, its own fenced yard and patio, laundry, a 2-car garage, and ample off-street parking, creating the feel of two single-family homes. The original single-level Anapamu residence was built in 1910 and extensively remodeled in 2004, when the two-story San Andres residence was built. Delivered vacant and move-in ready with a new roof. Ideal as an investment or an opportunity to occupy one home while generating rental income from the other. Four garage spaces, separate outdoor areas, and a location convenient to downtown, restaurants, shopping, transportation, and nearby schools.
Active
$2,075,000
1204 San Andres St, Santa Barbara, CA 93101
6beds
2,429sqft
Single Family Residence
Built in 2005
5,662 Square Feet Lot
$1,989,500 Zestimate®
$854/sqft
$-- HOA
What's special
- 20 days
- 842
- 41
Zillow last checked:
Listing updated:
Listed by:
Charles C Aljian 01985594 805-689-6390,
Village Properties,
Marcia Ribeiro 02203936 805-245-4550,
Village Properties - 1
Source: SBMLS,MLS#: 26-3317
Facts & features
Interior
Bedrooms & bathrooms
- Bedrooms: 6
- Bathrooms: 4
- Full bathrooms: 4
Heating
- Forced Air
Appliances
- Included: Refrigerator, Gas Range, Dryer, Microwave, Washer
- Laundry: In Unit
Features
- Recessed Lighting
- Flooring: Hardwood, Tile
- Has fireplace: No
Interior area
- Total structure area: 2,429
- Total interior livable area: 2,429 sqft
Property
Parking
- Total spaces: 4
- Parking features: Attached
- Attached garage spaces: 4
Features
- Levels: Single Story,Two
- Fencing: Full
Lot
- Size: 5,662 Square Feet
- Features: Near Public Transit
Details
- Parcel number: 039151007
Construction
Type & style
- Home type: SingleFamily
- Property subtype: Single Family Residence
Materials
- Stucco
- Roof: Composition
Condition
- Good
- Year built: 2005
Community & HOA
Community
- Features: Sidewalks, Street Lights
- Subdivision: 20 - Westside
Location
- Region: Santa Barbara
Financial & listing details
- Price per square foot: $854/sqft
- Tax assessed value: $2,069,355
- Date on market: 10/1/2026
- Cumulative days on market: 20 days
- Listing terms: Conventional,Cash
Estimated market value
$1,989,500
$1.89M - $2.09M
$8,104/mo
Price history
| Date | Event | Price |
|---|---|---|
| 10/1/2026 | Listed for sale | $2,075,000-9.4%$854/sqft |
Source:  SBMLS #26-3314 Report a problem | ||
| 9/20/2026 | Listing removed | $2,290,000$943/sqft |
Source: SBMLS #26-256 Report a problem | ||
| 5/31/2026 | Price change | $2,290,000+4.6%$943/sqft |
Source: SBMLS #26-256 Report a problem | ||
| 3/30/2026 | Price change | $2,190,000-6.4%$902/sqft |
Source: SBMLS #26-256 Report a problem | ||
| 1/24/2026 | Listed for sale | $2,340,000+20%$963/sqft |
Source: SBMLS #26-256 Report a problem | ||
| 7/22/2023 | Listing removed | -- |
Source:  CLAW #22-137539 Report a problem | ||
| 7/18/2022 | Sold | $1,950,000-2.3%$803/sqft |
Source: SBMLS #22-777 Report a problem | ||
| 5/12/2022 | Pending sale | $1,995,000$821/sqft |
Source: SBMLS #22-777 Report a problem | ||
| 3/14/2022 | Listed for sale | $1,995,000+59.7%$821/sqft |
Source: SBMLS #22-777 Report a problem | ||
| 6/10/2019 | Listing removed | $1,249,000$514/sqft |
Source: Goodwin & Thyne Properties #19-291 Report a problem | ||
| 1/29/2019 | Listed for sale | $1,249,000$514/sqft |
Source: Goodwin & Thyne Properties #19-291 Report a problem | ||
| 12/28/2018 | Listing removed | $1,249,000$514/sqft |
Source: Goodwin & Thyne Properties #18-3517 Report a problem | ||
| 11/9/2018 | Price change | $1,249,000-2%$514/sqft |
Source: Goodwin & Thyne Properties #18-3517 Report a problem | ||
| 9/27/2018 | Listed for sale | $1,275,000+8.5%$525/sqft |
Source: Goodwin & Thyne Properties #18-3517 Report a problem | ||
| 6/17/2016 | Sold | $1,175,000$484/sqft |
Source: Public Record Report a problem | ||
Public tax history
| Year | Property taxes | Tax assessment |
|---|---|---|
| 2026 | -- | $2,069,355 +2% |
| 2025 | $21,435 +1.7% | $2,028,780 +2% |
| 2024 | $21,068 +1.8% | $1,989,000 +2% |
| 2023 | $20,686 +48.2% | $1,950,000 +48.8% |
| 2022 | $13,954 +2.4% | $1,310,732 +2% |
| 2021 | $13,633 +1% | $1,285,032 +1% |
| 2020 | $13,493 +1.8% | $1,271,856 +2% |
| 2019 | $13,258 +1.4% | $1,246,919 +2% |
| 2018 | $13,070 +3.4% | $1,222,470 +2% |
| 2017 | $12,639 +40.3% | $1,198,500 +40.5% |
| 2016 | $9,008 +1.1% | $852,910 +1.5% |
| 2015 | $8,910 +1.7% | $840,100 +2% |
| 2014 | $8,764 | $823,645 +9.8% |
| 2012 | -- | $750,000 |
| 2011 | -- | $750,000 -4.1% |
| 2010 | -- | $782,202 -0.2% |
| 2009 | -- | $784,061 +2% |
| 2008 | -- | $768,688 +2% |
| 2007 | -- | $753,616 +23.6% |
| 2006 | -- | $609,611 +18.5% |
| 2005 | -- | $514,325 +874.4% |
| 2003 | -- | $52,786 +2% |
| 2002 | -- | $51,752 +2% |
| 2001 | -- | $50,738 +2% |
| 2000 | -- | $49,744 |
Find assessor info on the county website
Monthly payment
Est. payment
Payment breakdown
Explore the cost of this home by adjusting the details. Changes won't be saved.Climate risks
Neighborhood: Westside
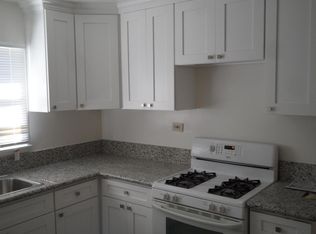
- $934,6001 bd1 ba672 sqft1216 San Andres St, Santa Barbara, CA 93101Off Market
- $1,496,8002 bd1 ba-- sqft1224 1/2 San Andres St, Santa Barbara, CA 93101Off Market
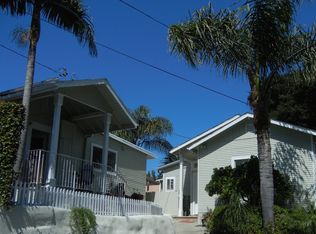
- $1,317,3004 bd3 ba-- sqft630 W Anapamu St, Santa Barbara, CA 93101Off Market
- $877,6001 bd0 ba702 sqft1216 1/2 San Andres St, Santa Barbara, CA 93101Off Market
Similar homes
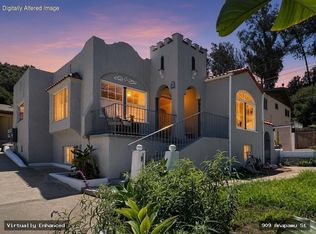
- $2,150,0006 bd3 ba2.6k sqft909 W Anapamu St, Santa Barbara, CA 93101For Sale
 MLS ID #26-3008, John Venti. SBMLS
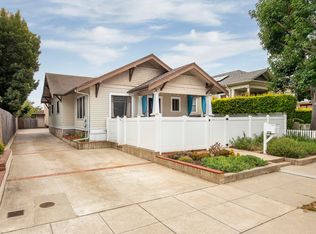
- $1,990,0005 bd4 ba1.5k sqft1715 Bath St, Santa Barbara, CA 93101For Sale
 MLS ID #26-2822, Tony Cavalli III. SBMLS
- $2,250,0005 bd3 ba1.3k sqft318 W Cota St, Santa Barbara, CA 93101For Sale
 MLS ID #26-2821, Eddie Madrigal. SBMLS
- $1,795,0003 bd2 ba1.4k sqft1776 Calle Poniente, Santa Barbara, CA 93101For Sale
 MLS ID #26-3516, Ali Evans. SBMLS
