Single level home in the Brookfield section Of Brockton in a lovely neighborhood. House is being sold as is.
For sale by owner
Street View
$450,000
130 Lester Rd, Brockton, MA 02302
4beds
2,000sqft
SingleFamily
Built in 1960
0.31 Acres Lot
$547,300 Zestimate®
$225/sqft
$-- HOA
Overview
- 4 days
- 469
- 14
Listed by:
Property Owner (617) 462-8109
Facts & features
Interior
Bedrooms & bathrooms
- Bedrooms: 4
- Bathrooms: 2
- Full bathrooms: 1
- 1/2 bathrooms: 1
Heating
- Heat pump, Oil
Appliances
- Included: Dishwasher, Dryer, Freezer, Microwave, Range / Oven, Refrigerator, Washer
Features
- Flooring: Carpet
- Basement: None
- Has fireplace: Yes
Interior area
- Total interior livable area: 2,000 sqft
Property
Parking
- Total spaces: 5
- Parking features: Off-street
Features
- Exterior features: Vinyl
- View description: None
Lot
- Size: 0.31 Acres
Details
- Parcel number: BROCM178R258S
Construction
Type & style
- Home type: SingleFamily
Materials
- Foundation: Slab
- Roof: Shake / Shingle
Condition
- New construction: No
- Year built: 1960
Community & HOA
Location
- Region: Brockton
Financial & listing details
- Price per square foot: $225/sqft
- Tax assessed value: $431,100
- Annual tax amount: $5,221
- Date on market: 10/30/2026
Estimated market value
$547,300
$509,000 - $580,000
$3,832/mo
Price history
| Date | Event | Price |
|---|---|---|
| 10/30/2026 | Listed for sale | $450,000$225/sqft |
Source: Owner Report a problem | ||
Public tax history
| Year | Property taxes | Tax assessment |
|---|---|---|
| 2025 | $5,221 +2% | $431,100 +1.2% |
| 2024 | $5,121 +4.5% | $426,000 +12.9% |
| 2023 | $4,899 +7.8% | $377,400 +16.1% |
| 2022 | $4,543 +3.2% | $325,200 +7.1% |
| 2021 | $4,402 -1.2% | $303,600 +3.2% |
| 2020 | $4,456 +8% | $294,100 +10.8% |
| 2019 | $4,126 +3.8% | $265,500 +7.3% |
| 2018 | $3,975 +11.4% | $247,500 +11.7% |
| 2017 | $3,568 +4.3% | $221,600 +12.4% |
| 2016 | $3,422 +5.5% | $197,100 +10.2% |
| 2015 | $3,245 -1.2% | $178,800 -1.3% |
| 2014 | $3,285 +7.2% | $181,200 -0.2% |
| 2013 | $3,065 +4.9% | $181,600 +0.3% |
| 2012 | $2,921 -2.7% | $181,000 -7.8% |
| 2011 | $3,003 +15.2% | $196,400 +3.8% |
| 2010 | $2,607 +4.4% | $189,300 -15.8% |
| 2009 | $2,496 -1.1% | $224,900 -14.5% |
| 2008 | $2,525 -4.4% | $263,000 -6.4% |
| 2007 | $2,640 +2.5% | $281,100 +4.1% |
| 2006 | $2,576 +1.2% | $270,000 +12.7% |
| 2005 | $2,545 +7.5% | $239,600 +16.5% |
| 2004 | $2,368 +3.6% | $205,700 +13.8% |
| 2003 | $2,285 +4.1% | $180,800 +14.5% |
| 2002 | $2,196 +15.3% | $157,900 +49.7% |
| 2000 | $1,905 | $105,500 |
Find assessor info on the county website
Monthly payment
Est. payment
Payment breakdown
Explore the cost of this home by adjusting the details. Changes won't be saved.Climate risks
Neighborhood: 02302

Similar homes
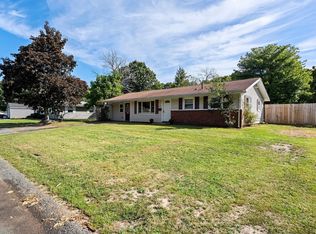
- $415,0003 bd1 ba1.3k sqft15 Elsie Rd, Brockton, MA 02302For Sale
 MLS ID #73597989, John Hagberg, All Business Realty, Inc.. MLS PIN
- $--3 bd2 ba1.3k sqft98 Quincy St, Brockton, MA 02302Auction
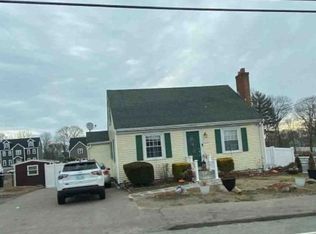 Xome
- $444,9993 bd2 ba1.5k sqft223 Elsie Rd, Brockton, MA 02302For Sale
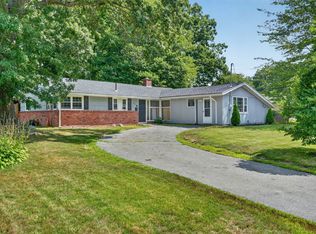 MLS ID #73569768, Jeff Grand, Centre Realty Group. MLS PIN
- $399,8003 bd3 ba1.4k sqft43 Delmar Rd, Brockton, MA 02302For Sale
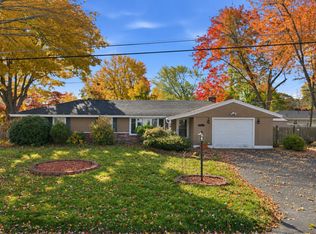 MLS ID #73597942, Jordan Andrade, LPT Realty - Home & Key Group. MLS PIN
