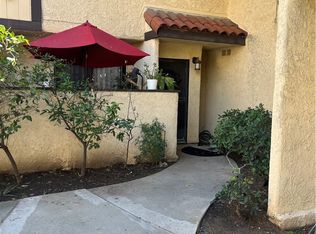
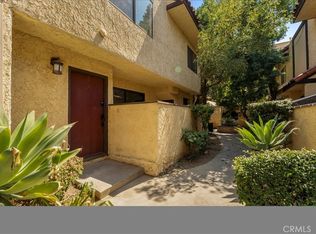
Price Improvement! Great opportunity to own a 2-bedroom, 2-bathroom condominium with plenty of potential to add value. The property features a functional floor plan, central AC and heating, a community pool, and 2 tandem parking spaces. With the right updates, this property has the potential to become a beautiful and comfortable home. Bring your vision and turn this property into a great investment or future home!
For sale
Listed by: Coldwell Banker Exclusive • Benjamin Iraheta • 818-238-7387
Price cut: $40.1K (9/29)
$359,900
13540 Hubbard St Unit 39, Sylmar, CA 91342
2beds
1,156sqft
Condominium
Built in 1981
-- sqft lot
$360,500 Zestimate®
$311/sqft
$480/mo HOA
What's special
- 71 days
- 235
- 7
Zillow last checked:
Listing updated:
Listed by:
Benjamin Iraheta DRE #01792735 818-238-7387,
Coldwell Banker Exclusive
Source: CRMLS,MLS#: SR26197080 Originating MLS: California Regional MLS
Facts & features
Interior
Bedrooms & bathrooms
- Bedrooms: 2
- Bathrooms: 2
- Full bathrooms: 2
- Main level bathrooms: 1
Rooms
- Room types: Living Room
Heating
- Central
Cooling
- Central Air
Appliances
- Laundry: Inside
Features
- Has fireplace: No
- Fireplace features: None
- Common walls with other units/homes: 2+ Common Walls
Interior area
- Total interior livable area: 1,156 sqft
Property
Features
- Levels: Two
- Stories: 2
- Entry location: 1
- Pool features: Community, Association
Lot
- Size: 1.97 Acres
Details
- Parcel number: 2512001072
- Special conditions: Standard
Construction
Type & style
- Home type: Condo
- Property subtype: Condominium
- Attached to another structure: Yes
Condition
- New construction: No
- Year built: 1981
Utilities & green energy
- Sewer: Public Sewer
- Water: Public
Community & HOA
Community
- Features: Street Lights, Sidewalks, Pool
HOA
- Has HOA: Yes
- Amenities included: Pool
- HOA fee: $480 monthly
- HOA name: Olive Mountain View
- HOA phone: 888-969-1078
Location
- Region: Sylmar
Financial & listing details
- Price per square foot: $311/sqft
- Tax assessed value: $369,787
- Date on market: 9/8/2026
- Cumulative days on market: 72 days
- Listing terms: Cash,Conventional
Estimated market value
$360,500
$342,000 - $379,000
$2,790/mo
Price history
| Date | Event | Price |
|---|---|---|
| 9/29/2026 | Price change | $359,900-10%$311/sqft |
Source:  CRMLS #SR26197080 Report a problem | ||
| 9/9/2026 | Listed for sale | $399,999+23.1%$346/sqft |
Source: CRMLS #SR26197080 Report a problem | ||
| 4/8/2019 | Sold | $325,000$281/sqft |
Source:  CRMLS #BB19012763 Report a problem | ||
| 2/8/2019 | Pending sale | $325,000$281/sqft |
Source: Keller Williams Realty Burbank #BB19012763 Report a problem | ||
| 1/17/2019 | Listed for sale | $325,000+14%$281/sqft |
Source: Keller Williams Realty Burbank #BB19012763 Report a problem | ||
| 9/28/2016 | Sold | $285,000$247/sqft |
Source: Public Record Report a problem | ||
| 7/18/2016 | Pending sale | $285,000$247/sqft |
Source: RE/MAX Olson & Associates,Inc. #SR16127022 Report a problem | ||
| 6/13/2016 | Listed for sale | $285,000-8.1%$247/sqft |
Source: RE/MAX Olson & Associates,Inc. #SR16127022 Report a problem | ||
| 5/1/2013 | Listing removed | $1,495$1/sqft |
Source: Century 21 All Moves #SR13036398 Report a problem | ||
| 4/9/2013 | Price change | $1,495-11%$1/sqft |
Source: Century 21 All Moves #SR13036398 Report a problem | ||
| 3/6/2013 | Listed for rent | $1,680$1/sqft |
Source: Century 21 All Moves #SR13036398 Report a problem | ||
| 8/19/2005 | Sold | $310,000+27.6%$268/sqft |
Source: Public Record Report a problem | ||
| 10/1/2004 | Sold | $243,000+51.9%$210/sqft |
Source: Public Record Report a problem | ||
| 10/31/2003 | Sold | $160,000+8.1%$138/sqft |
Source: Public Record Report a problem | ||
| 3/28/2003 | Sold | $148,000+107%$128/sqft |
Source: Public Record Report a problem | ||
| 11/9/1998 | Sold | $71,500+38.5%$62/sqft |
Source: Public Record Report a problem | ||
| 6/9/1998 | Sold | $51,618$45/sqft |
Source: Public Record Report a problem | ||
Public tax history
| Year | Property taxes | Tax assessment |
|---|---|---|
| 2026 | -- | $369,787 +2% |
| 2025 | $4,511 +1.2% | $362,538 +2% |
| 2024 | $4,456 +1.9% | $355,431 +2% |
| 2023 | $4,371 +4.9% | $348,463 +2% |
| 2022 | $4,168 +1.3% | $341,631 +2% |
| 2021 | $4,114 -0.9% | $334,934 +1% |
| 2020 | $4,153 | $331,500 +11.8% |
| 2019 | $4,153 +14.8% | $296,513 +2% |
| 2018 | $3,616 | $290,700 +2% |
| 2017 | $3,616 +2.3% | $285,000 +19.2% |
| 2016 | $3,536 +22.6% | $239,000 |
| 2015 | $2,883 +17.4% | $239,000 +20.7% |
| 2014 | $2,455 | $198,000 +50% |
| 2012 | -- | $132,000 -7.9% |
| 2011 | -- | $143,400 |
| 2010 | -- | $143,400 |
| 2009 | -- | $143,400 -47.4% |
| 2008 | -- | $272,800 -13.7% |
| 2007 | -- | $316,200 +2% |
| 2006 | -- | $310,000 +25.1% |
| 2005 | -- | $247,860 +54.9% |
| 2004 | -- | $160,000 +106.7% |
| 2003 | -- | $77,391 +2% |
| 2002 | -- | $75,874 +4% |
| 2000 | -- | $72,930 |
Find assessor info on the county website
Monthly payment
Est. payment
Payment breakdown
Explore the cost of this home by adjusting the details. Changes won't be saved.Climate risks
Neighborhood: Sylmar

Similar homes
- $430,0002 bd2 ba1.1k sqft13540 Hubbard St Unit 10, Sylmar, CA 91342For Sale
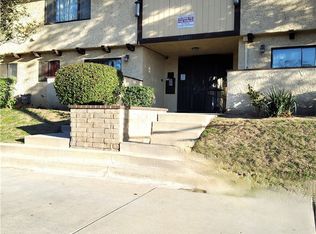 MLS ID #DW26214752, Maria Solis, SoCal 5 Real Estate. CRMLS
- $460,0002 bd2 ba959 sqft13750 Hubbard St Unit 63, Sylmar, CA 91342For Sale
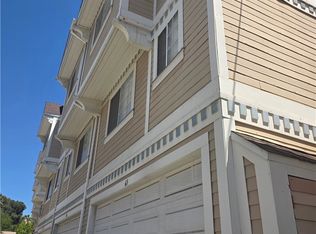 MLS ID #DW26185700, Juan Sanchez Sr., Excellence RE Real Estate, Inc.. CRMLS
- $449,0003 bd3 ba1.1k sqft13750 Hubbard St, Sylmar, CA 91342For Sale
 MLS ID #SR26190215, Meline Khacheryan, RE/MAX One. CRMLS
- $395,0003 bd2 ba1k sqft18350 Hatteras St, Tarzana, CA 91356For Sale
 MLS ID #SR26244125, Anthony Friedman, Friedman Realty & Investments Inc. CRMLS
