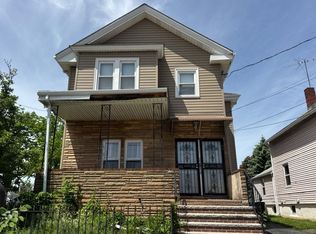
Great opportunity to own a 2 family rental investment in central Malden location. Many recent updates including roof, electrical, gas central heat. Vinyl windows,vinyl siding, hw flooring, 4 parking spots, a very low maintenance property. Close proximity to a park, 1 block from bus stop. Fully rented long term tenants.
For sale
$859,000
140 Lyme St, Malden, MA 02148
5beds
2,004sqft
Multi Family
Built in 1920
-- sqft lot
$848,900 Zestimate®
$429/sqft
$-- HOA
What's special
Vinyl sidingVinyl windows
- 66 days |
- 473 |
- 16 |
Zillow last checked:
Listing updated:
Listed by:
Dan Ton 781-888-0004,
Kava Realty Group, Inc. 617-506-0701
Source: MLS PIN,MLS#: 73509652
Loading...
Facts & features
Interior
Bedrooms & bathrooms
- Bedrooms: 5
- Bathrooms: 2
- Full bathrooms: 2
Features
- Flooring: Wood
- Basement: Full
- Has fireplace: No
Interior area
- Total structure area: 2,004
- Total interior livable area: 2,004 sqft
- Finished area above ground: 2,004
Property
Parking
- Total spaces: 4
- Parking features: Off Street
- Uncovered spaces: 4
Features
- Patio & porch: Porch, Deck
Lot
- Size: 3,197 Square Feet
- Features: Corner Lot, Cleared, Level
Details
- Parcel number: M:118 B:441 L:101,599499
- Zoning: ResA
Construction
Type & style
- Home type: MultiFamily
- Property subtype: Multi Family
Materials
- Frame
- Foundation: Granite
- Roof: Shingle
Condition
- Year built: 1920
Utilities & green energy
- Electric: 110 Volts, Circuit Breakers
- Sewer: Public Sewer
- Water: Public
Community & HOA
Community
- Features: Public Transportation, Shopping
Location
- Region: Malden
Financial & listing details
- Price per square foot: $429/sqft
- Tax assessed value: $689,600
- Annual tax amount: $7,806
- Date on market: 4/29/2026
- Total actual rent: 5817
Estimated market value
$848,900
$806,000 - $891,000
$3,373/mo
Price history
| Date | Event | Price |
|---|---|---|
| 6/12/2026 | Listed for sale | $859,000$429/sqft |
Source: MLS PIN #73509652 Report a problem | ||
| 6/3/2026 | Contingent | $859,000$429/sqft |
Source: MLS PIN #73509652 Report a problem | ||
| 4/29/2026 | Listed for sale | $859,000+22.7%$429/sqft |
Source: MLS PIN #73509652 Report a problem | ||
| 12/10/2021 | Sold | $700,000+0.1%$349/sqft |
Source: MLS PIN #72880107 Report a problem | ||
| 10/28/2021 | Contingent | $699,000$349/sqft |
Source: MLS PIN #72880107 Report a problem | ||
| 10/20/2021 | Listed for sale | $699,000-9.1%$349/sqft |
Source: MLS PIN #72880107 Report a problem | ||
| 10/3/2021 | Listing removed | $769,000$384/sqft |
Source: MLS PIN #72880107 Report a problem | ||
| 9/9/2021 | Price change | $769,000-3.8%$384/sqft |
Source: MLS PIN #72880107 Report a problem | ||
| 8/11/2021 | Listed for sale | $799,000+218.3%$399/sqft |
Source: MLS PIN #72880107 Report a problem | ||
| 11/25/2008 | Sold | $251,000-32.7%$125/sqft |
Source: Public Record Report a problem | ||
| 12/27/2007 | Sold | $372,767-12.1%$186/sqft |
Source: Public Record Report a problem | ||
| 5/4/2005 | Sold | $424,000+16.2%$212/sqft |
Source: Public Record Report a problem | ||
| 4/30/2004 | Sold | $365,000$182/sqft |
Source: Public Record Report a problem | ||
Public tax history
| Year | Property taxes | Tax assessment |
|---|---|---|
| 2025 | $7,806 +3.1% | $689,600 +6.5% |
| 2024 | $7,568 +3.8% | $647,400 +8.2% |
| 2023 | $7,292 +6.8% | $598,200 +8.2% |
| 2022 | $6,826 +5.2% | $552,700 +4.7% |
| 2021 | $6,488 +3.8% | $527,900 +6.9% |
| 2020 | $6,248 +5.1% | $493,900 +10.3% |
| 2019 | $5,942 +5.7% | $447,800 +12.2% |
| 2018 | $5,623 +2.8% | $399,100 +3.4% |
| 2017 | $5,471 +3% | $386,100 +10.2% |
| 2016 | $5,312 +4.5% | $350,400 +8.4% |
| 2015 | $5,084 +7.9% | $323,200 +10.4% |
| 2014 | $4,712 +5.4% | $292,700 +4% |
| 2013 | $4,470 +13.4% | $281,500 +2.4% |
| 2012 | $3,941 +2.2% | $275,000 -3.1% |
| 2011 | $3,855 -0.9% | $283,900 -9.6% |
| 2010 | $3,890 +2.4% | $314,000 -18.1% |
| 2009 | $3,799 -8.6% | $383,400 -16.6% |
| 2008 | $4,157 +21.4% | $459,900 +10.8% |
| 2007 | $3,425 +10.4% | $415,100 +9.8% |
| 2006 | $3,103 +1.9% | $378,000 +7.9% |
| 2005 | $3,045 +2.9% | $350,400 +5.5% |
| 2004 | $2,959 +14.7% | $332,100 +81.1% |
| 2003 | $2,579 +3.9% | $183,400 |
| 2002 | $2,483 +14.1% | $183,400 +46.8% |
| 2000 | $2,177 +12.3% | $124,900 +8.6% |
| 1999 | $1,938 | $115,000 |
Find assessor info on the county website
Monthly payment
Est. payment$--/mo
Payment breakdown
Explore the cost of this home by adjusting the details. Changes won't be saved.All calculations are estimates and provided by Zillow, Inc. for informational purposes only. Actual amounts may vary.
HOA fees may include property taxes on listings classified as Co-Ops. Contact the listing agent and/or owner for fee details.
Mortgage interest rates are dependent on a number of factors, including credit score, down payment, and repayment length. Interest rate data provided by Zillow Group Marketplace, Inc. as of 1/1/1970 from various mortgage lenders with which we have lead or other similar arrangements; the Estimated Payment is an average of those rates.
See how much you could borrow to make a competitive offer.
Climate risks
Neighborhood: Faulkner
Nearby schools
GreatSchools rating
- 4/10Salemwood SchoolGrades: K-8Distance: 0.4 mi
- 4/10Malden High SchoolGrades: 9-12Distance: 0.7 mi
- 7/10Ferryway SchoolGrades: K-8Distance: 0.5 mi


A local agent can set up tours, give advice and negotiate with sellers.
A local lender can help you make sure your offer is ready when you are.


Nearby cities
Nearby neighborhoods
Nearby zip codes
Other Malden Topics
