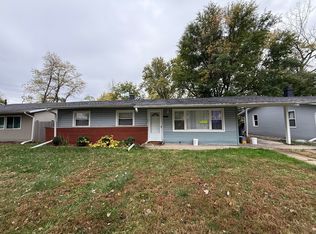
$156,100
3 bd1 ba1k sqft
16035 Circle Dr, Markham, IL 60428
Off Market
Likely to sell faster than
Zillow last checked:
Listing updated:
Keith Terry (773)655-1360,
eXp Realty

$115,100
$109,000 - $121,000
$2,556/mo
| Date | Event | Price |
|---|---|---|
| 11/18/2026 | Price change | $99,000-13.1%$99/sqft |
Source: MRED as distributed by MLS GRID #12808901 Report a problem | ||
| 11/14/2026 | Listed for sale | $113,900+26.7%$114/sqft |
Source:  MRED as distributed by MLS GRID #12808901 Report a problem | ||
| 8/7/2026 | Listing removed | $89,900$90/sqft |
Source: MRED as distributed by MLS GRID #12512436 Report a problem | ||
| 1/6/2026 | Pending sale | $89,900$90/sqft |
Source: MRED as distributed by MLS GRID #12512436 Report a problem | ||
| 12/12/2025 | Listed for sale | $89,900$90/sqft |
Source: MRED as distributed by MLS GRID #12512436 Report a problem | ||
| 11/20/2025 | Pending sale | $89,900$90/sqft |
Source: MRED as distributed by MLS GRID #12512436 Report a problem | ||
| 11/20/2025 | Listed for sale | $89,900$90/sqft |
Source: MRED as distributed by MLS GRID #12512436 Report a problem | ||
| 11/20/2025 | Pending sale | $89,900$90/sqft |
Source: MRED as distributed by MLS GRID #12512436 Report a problem | ||
| 11/6/2025 | Listed for sale | $89,900$90/sqft |
Source: MRED as distributed by MLS GRID #12512436 Report a problem | ||
| 11/6/2025 | Listing removed | $89,900$90/sqft |
Source: MRED as distributed by MLS GRID #12479458 Report a problem | ||
| 11/6/2025 | Price change | $89,900-5.3%$90/sqft |
Source: MRED as distributed by MLS GRID #12479458 Report a problem | ||
| 11/3/2025 | Price change | $94,900-9.5%$95/sqft |
Source: MRED as distributed by MLS GRID #12479458 Report a problem | ||
| 10/23/2025 | Price change | $104,900-4.5%$105/sqft |
Source: MRED as distributed by MLS GRID #12479458 Report a problem | ||
| 9/24/2025 | Listed for sale | $109,900-29.1%$110/sqft |
Source: MRED as distributed by MLS GRID #12479458 Report a problem | ||
| 10/19/2024 | Listing removed | $154,900$155/sqft |
Source: MRED as distributed by MLS GRID #12186942 Report a problem | ||
| 10/12/2024 | Listed for sale | $154,900+47.5%$155/sqft |
Source: MRED as distributed by MLS GRID #12186942 Report a problem | ||
| 9/18/2006 | Sold | $105,000+159.3%$105/sqft |
Source: Public Record Report a problem | ||
| 8/15/2001 | Sold | $40,500$41/sqft |
Source: Public Record Report a problem | ||
| Year | Property taxes | Tax assessment |
|---|---|---|
| 2024 | $4,803 +8.2% | $11,000 |
| 2023 | $4,440 +183.1% | $11,000 +106% |
| 2022 | $1,568 -1.4% | $5,341 |
| 2021 | $1,591 -8.1% | $5,341 |
| 2020 | $1,731 -44.4% | $5,341 -30.2% |
| 2019 | $3,116 +3.5% | $7,653 |
| 2018 | $3,010 +4.2% | $7,653 |
| 2017 | $2,890 +0.6% | $7,653 +14.2% |
| 2016 | $2,873 +11.8% | $6,699 |
| 2015 | $2,569 -1.5% | $6,699 |
| 2014 | $2,608 -16% | $6,699 -16.6% |
| 2013 | $3,107 +4.8% | $8,035 |
| 2012 | $2,965 +0.1% | $8,035 |
| 2011 | $2,962 -9.6% | $8,035 -16.8% |
| 2010 | $3,277 +0.1% | $9,661 |
| 2009 | $3,273 +11.3% | $9,661 -5% |
| 2008 | $2,940 -9.8% | $10,170 +7.7% |
| 2007 | $3,260 -5.1% | $9,442 |
| 2006 | $3,437 +10% | $9,442 |
| 2005 | $3,125 +49.9% | $9,442 +58% |
| 2004 | $2,084 +5.1% | $5,976 |
| 2003 | $1,983 +2.6% | $5,976 |
| 2002 | $1,933 -0.8% | $5,976 +11.6% |
| 2001 | $1,949 +5.1% | $5,355 |
| 2000 | $1,854 +5.1% | $5,355 |
| 1999 | $1,764 | $5,355 |
Source: MRED as distributed by MLS GRID. This data may not be complete. We recommend contacting the local school district to confirm school assignments for this home.


A local agent can set up tours, give advice and negotiate with sellers.