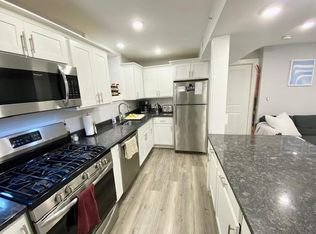
Ideally situated on a desirable South Boston street, this beautifully maintained, turnkey three-family offers an outstanding combination of location, generous living spaces, and strong rental income. Featuring 10 bedrooms and six full bathrooms across three thoughtfully configured residences, the property offers versatility and lasting investment appeal.Unit 1 is a spacious five-bedroom duplex featuring three full bathrooms. Unit 2 offers three bedrooms and two full bathrooms, while Unit 3 features two bedrooms, one full bathroom, and a spectacular private deck—an extraordinary outdoor retreat and a true standout feature of the property. A lovely backyard provides additional outdoor space.Generating $186,000 in annual gross rental income, with all three units leased through August 31, 2027, this property presents an opportunity for immediate income and long-term investment potential.With its desirable location, attractive unit layouts, exceptional outdoor amenities, and turnkey condition, 18 Atlantic Street is a compelling addition to any real estate portfolio.
For sale
$2,700,000
18 Atlantic St, South Boston, MA 02127
10beds
2,611sqft
3 Family
Built in 1898
-- sqft lot
$2,478,800 Zestimate®
$1,034/sqft
$-- HOA
What's special
Lovely backyardSpectacular private deckExceptional outdoor amenitiesGenerous living spacesSpacious five-bedroom duplexExtraordinary outdoor retreat
- 4 days
- 181
- 7
Likely to sell faster than
Zillow last checked:
Listing updated:
Listed by:
Maria Renda 857-222-6640,
True North Boston Realty LLC 617-982-6868
Source: MLS PIN,MLS#: 73600331
Facts & features
Interior
Bedrooms & bathrooms
- Bedrooms: 10
- Bathrooms: 6
- Full bathrooms: 6
Features
- Basement: Finished
- Has fireplace: No
Interior area
- Total structure area: 2,611
- Total interior livable area: 2,611 sqft
- Finished area above ground: 2,611
Property
Lot
- Size: 2,000 Square Feet
- Features: Other
Details
- Parcel number: W:07 P:01032 S:000,1410969
- Zoning: R3
Construction
Type & style
- Home type: MultiFamily
- Property subtype: 3 Family
Materials
- Foundation: Other
Condition
- Year built: 1898
Utilities & green energy
- Sewer: Public Sewer
- Water: Public
Community & HOA
Location
- Region: South Boston
Financial & listing details
- Price per square foot: $1,034/sqft
- Tax assessed value: $2,026,400
- Annual tax amount: $25,127
- Date on market: 11/9/2026
- Total actual rent: 15500
Estimated market value
$2,478,800
$2.03M - $2.95M
Not available
Price history
| Date | Event | Price |
|---|---|---|
| 11/9/2026 | Listed for sale | $2,700,000+13.7%$1,034/sqft |
Source: MLS PIN #73600331 Report a problem | ||
| 8/17/2023 | Listing removed | -- |
Source: Zillow Rentals Report a problem | ||
| 7/12/2023 | Listed for rent | $4,600-23.3%$2/sqft |
Source: Zillow Rentals Report a problem | ||
| 6/2/2022 | Listing removed | -- |
Source: Zillow Rental Manager Report a problem | ||
| 5/23/2022 | Price change | $6,000+33.3%$2/sqft |
Source: Zillow Rental Manager Report a problem | ||
| 5/8/2022 | Listed for rent | $4,500-26.8%$2/sqft |
Source: Zillow Rental Manager Report a problem | ||
| 5/31/2019 | Listing removed | $6,150$2/sqft |
Source: Zillow Rental Manager Report a problem | ||
| 4/30/2019 | Price change | $6,150+115.8%$2/sqft |
Source: Zillow Rental Manager Report a problem | ||
| 3/20/2019 | Listed for rent | $2,850+3.6%$1/sqft |
Source: Zillow Rental Manager Report a problem | ||
| 3/15/2019 | Sold | $2,375,000+187.9%$910/sqft |
Source: Public Record Report a problem | ||
| 7/25/2018 | Listing removed | $2,750$1/sqft |
Source: Zillow Rental Manager Report a problem | ||
| 7/22/2018 | Price change | $2,750-54.2%$1/sqft |
Source: Zillow Rental Manager Report a problem | ||
| 3/21/2018 | Listed for rent | $6,000$2/sqft |
Source: Zillow Rental Manager Report a problem | ||
| 10/31/2017 | Sold | $825,000$316/sqft |
Source: Public Record Report a problem | ||
Public tax history
| Year | Property taxes | Tax assessment |
|---|---|---|
| 2025 | $21,930 +10.2% | $1,893,800 +3.8% |
| 2024 | $19,894 +7.6% | $1,825,100 +6% |
| 2023 | $18,492 +8.6% | $1,721,800 +10% |
| 2022 | $17,030 +2% | $1,565,300 |
| 2021 | $16,702 +26.1% | $1,565,300 +24.8% |
| 2020 | $13,249 +464% | $1,254,600 +462.9% |
| 2019 | $2,349 -65.6% | $222,900 -65.8% |
| 2018 | $6,835 +360.4% | $652,200 +5% |
| 2017 | $1,485 -75% | $620,900 +15% |
| 2016 | $5,939 -2.6% | $539,900 +7.3% |
| 2015 | $6,095 +13.8% | $503,300 +23.4% |
| 2013 | $5,358 -6.9% | $407,800 -7.7% |
| 2012 | $5,758 +5% | $441,600 +3% |
| 2011 | $5,482 +6.6% | $428,600 -1% |
| 2010 | $5,143 +16.3% | $432,900 +4.1% |
| 2009 | $4,421 -2.8% | $415,900 +0.3% |
| 2008 | $4,548 -0.7% | $414,600 -0.6% |
| 2007 | $4,582 | $416,900 |
Find assessor info on the county website
Monthly payment
Est. payment
Payment breakdown
Explore the cost of this home by adjusting the details. Changes won't be saved.Climate risks
Neighborhood: South Boston


Similar homes
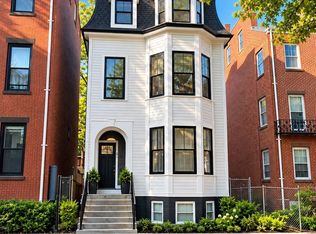
- $3,500,00013 bd6 ba2.7k sqft536 E Broadway, Boston, MA 02127For Sale
 MLS ID #73601504, Adam Burns, Burns Realty & Investments LLC. MLS PIN
- $2,398,8888 bd4 ba3k sqft395 E 4th St, Boston, MA 02127For Sale
 MLS ID #73590821, Ian Halpin, Lauchlin Real Estate Group. MLS PIN
- $2,449,9008 bd5 ba3.4k sqft510 E Broadway, Boston, MA 02127For Sale
 MLS ID #73595738, Cristofer Aguirre, EVO Real Estate Group, LLC. MLS PIN
- $1,950,0009 bd4 ba2.2k sqft271 W 5th St, South Boston, MA 02127For Sale
 MLS ID #73591362, Stephen McCarthy, William Raveis R.E. & Home Services. MLS PIN
