Great area and solid property to add to your portfolio! Welcome investors? Purchase with ease as this property is fully rented and ready to go. Monthly combined rent of $2525.00. Tenants maintain lawn and snow care. All utilities are separately metered. Per seller, New water heater (2025) and new furnace (2024). 2 bedroom and 1 bath each unit.
Active-offer no bump
$264,900
1822 S Bouten St, Appleton, WI 54915
4beds
2baths
1,790sqft
Duplex
Built in 1947
-- sqft lot
$266,400 Zestimate®
$148/sqft
$-- HOA
What's special
- 26 days
- 655
- 34
Zillow last checked:
Listing updated:
Listed by:
Tiffany L Holtz 920-415-0472,
Coldwell Banker Real Estate Group,
Mary E Adkins 920-420-0447,
Coldwell Banker Real Estate Group
Source: RANW as distributed by MLS GRID,MLS#: 50334355
Facts & features
Interior
Bedrooms & bathrooms
- Bedrooms: 4
- Bathrooms: 2
Heating
- Forced Air
Cooling
- Forced Air
Interior area
- Total interior livable area: 1,790 sqft
- Finished area above ground: 1,790
- Finished area below ground: 0
Video & virtual tour
Property
Parking
- Total spaces: 2
- Parking features: Detached, Outside
- Has garage: Yes
Accessibility
- Accessibility features: Not Applicable
Lot
- Size: 6,534 Square Feet
- Dimensions: 60X107
Details
- Parcel number: 314099200
- Zoning: 2 Family/Duplex
Construction
Type & style
- Home type: MultiFamily
- Property subtype: Duplex
Materials
- Vinyl Siding
- Foundation: Block
Condition
- New construction: No
- Year built: 1947
Utilities & green energy
- Sewer: Public Sewer
- Water: Public
- Utilities for property: Sep Electric Meter, Sep Gas Meter, Sep Water Meter/Unit
Community & HOA
Location
- Region: Appleton
Financial & listing details
- Price per square foot: $148/sqft
- Tax assessed value: $194,000
- Annual tax amount: $2,935
- Date on market: 10/15/2026
Estimated market value
$266,400
$253,000 - $280,000
$1,482/mo
Price history
| Date | Event | Price |
|---|---|---|
| 10/21/2026 | Contingent | $264,900$148/sqft |
Source:  WIREX MLS #50334355 Report a problem | ||
| 10/15/2026 | Listed for sale | $264,900+26.2%$148/sqft |
Source: RANW as distributed by MLS GRID #50334355 Report a problem | ||
| 3/15/2022 | Sold | $209,900+68.1%$117/sqft |
Source: Agent Provided Report a problem | ||
| 1/1/2014 | Listing removed | $124,900$70/sqft |
Source: First Weber Group #50079621 Report a problem | ||
| 7/4/2013 | Listed for sale | $124,900+16.7%$70/sqft |
Source: First Weber Group #50079621 Report a problem | ||
| 4/26/2004 | Sold | $107,000$60/sqft |
Source: Agent Provided Report a problem | ||
Public tax history
| Year | Property taxes | Tax assessment |
|---|---|---|
| 2025 | $2,935 +6.8% | $194,000 |
| 2024 | $2,748 -4.4% | $194,000 |
| 2023 | $2,875 +20.9% | $194,000 +61% |
| 2022 | $2,377 -3.6% | $120,500 |
| 2021 | $2,466 +8.3% | $120,500 |
| 2020 | $2,278 +3.6% | $120,500 |
| 2019 | $2,197 -6.2% | $120,500 +8.1% |
| 2018 | $2,343 +0.1% | $111,500 |
| 2017 | $2,341 +2% | $111,500 |
| 2016 | $2,296 -1.8% | $111,500 |
| 2015 | $2,338 +1% | $111,500 |
| 2014 | $2,316 -6.3% | $111,500 -5.7% |
| 2013 | $2,472 -0.3% | $118,200 |
| 2012 | $2,479 -1.9% | $118,200 |
| 2011 | $2,526 +0.1% | $118,200 |
| 2010 | $2,523 +4.8% | $118,200 |
| 2009 | $2,409 +1.3% | $118,200 |
| 2008 | $2,377 0% | $118,200 |
| 2007 | $2,377 +1.9% | $118,200 |
| 2006 | $2,333 -6.1% | $118,200 +6.5% |
| 2005 | $2,485 -2.9% | $111,000 |
| 2004 | $2,558 -5.5% | $111,000 |
| 2003 | $2,708 | $111,000 |
| 2002 | -- | $111,000 +22.9% |
| 2001 | -- | $90,300 |
| 2000 | -- | $90,300 |
Find assessor info on the county website
Monthly payment
Est. payment
Payment breakdown
Explore the cost of this home by adjusting the details. Changes won't be saved.Climate risks
Neighborhood: 54915

Similar homes
- $264,9003 bd2 ba1.5k sqft13 Ramlen Ct, Appleton, WI 54915For Sale
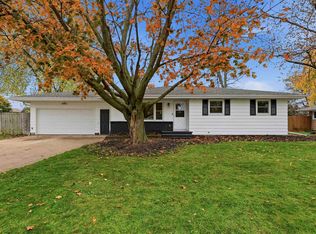 MLS ID #50335414, Greg R Busha. RANW as distributed by MLS GRID
- $234,9003 bd1 ba1.4k sqft292 Gardners Row, Appleton, WI 54915For Sale
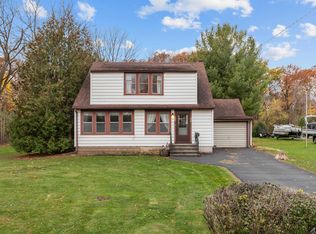 MLS ID #50335441, Sandi J Schober. RANW as distributed by MLS GRID
- $249,9004 bd2 ba1.3k sqft2417 Gmeiner Rd, Appleton, WI 54915For Sale
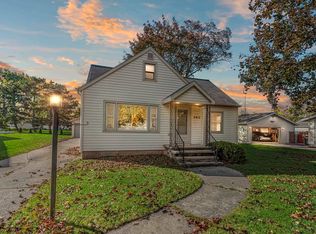 MLS ID #50334573, Dawn M Christensen. RANW as distributed by MLS GRID
- $289,8003 bd2 ba1.2k sqft438 W Foster St, Appleton, WI 54915For Sale
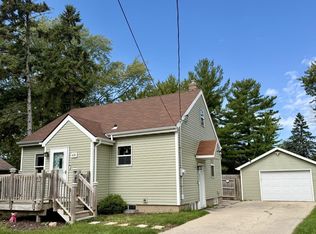 MLS ID #2032673, Angela Noltimier. SCWMLS
