Great investment opportunity just blocks from the heart of downtown Appleton! This upper/lower duplex offers over 2,000 sq ft of finished living space with separate utilities paid by tenants. The spacious lower unit features 3 bedrooms, while the upper offers 2 bedrooms and is currently occupied by a long-term month-to-month tenant. Low-maintenance vinyl exterior, off-street parking and a convenient location near College Avenue, shopping, dining and downtown entertainment. Ideal for an investor or an owner-occupant looking to offset their mortgage with rental income. Many updates including New roof, Basement work and lining. Each unit has independent heating and cooling. Some Photos have been enhanced with AI.
Active-no offer
Price cut: $5K (10/28)
$269,900
714 N Durkee St, Appleton, WI 54911
5beds
2baths
2,032sqft
Duplex
Built in 1875
-- sqft lot
$270,700 Zestimate®
$133/sqft
$-- HOA
What's special
Off-street parkingLow-maintenance vinyl exterior
- 69 days
- 382
- 17
Zillow last checked:
Listing updated:
Listed by:
Stacey L Hennessey PREF:920-470-9692,
Acre Realty, Ltd.,
Chris M Carson 920-410-0058,
Acre Realty, Ltd.
Source: RANW as distributed by MLS GRID,MLS#: 50331466
Facts & features
Interior
Bedrooms & bathrooms
- Bedrooms: 5
- Bathrooms: 2
Heating
- Forced Air
Cooling
- Forced Air, Central Air
Interior area
- Total interior livable area: 2,032 sqft
- Finished area above ground: 2,032
- Finished area below ground: 0
Property
Parking
- Parking features: Outside
Accessibility
- Accessibility features: 1st Floor Bedroom
Lot
- Size: 7,405 Square Feet
Details
- Parcel number: 316036600
- Zoning: 2 Family/Duplex
Construction
Type & style
- Home type: MultiFamily
- Property subtype: Duplex
Materials
- Vinyl Siding
- Foundation: Stone
Condition
- New construction: No
- Year built: 1875
Utilities & green energy
- Sewer: Public Sewer
- Water: Public
Community & HOA
Location
- Region: Appleton
Financial & listing details
- Price per square foot: $133/sqft
- Tax assessed value: $167,900
- Annual tax amount: $2,675
- Date on market: 8/21/2026
- Inclusions: 2 Storage sheds
Estimated market value
$270,700
$257,000 - $284,000
$1,523/mo
Price history
| Date | Event | Price |
|---|---|---|
| 10/28/2026 | Price change | $269,900-1.8%$133/sqft |
Source: RANW as distributed by MLS GRID #50331466 Report a problem | ||
| 8/21/2026 | Listed for sale | $274,900+37.5%$135/sqft |
Source:  WIREX MLS #50331466 Report a problem | ||
| 6/3/2024 | Sold | $199,900$98/sqft |
Source: RANW as distributed by MLS GRID #50289434 Report a problem | ||
| 6/3/2024 | Pending sale | $199,900$98/sqft |
Source: RANW as distributed by MLS GRID #50289434 Report a problem | ||
| 4/22/2024 | Contingent | $199,900$98/sqft |
Source: WIREX MLS #50289434 Report a problem | ||
| 4/9/2024 | Listed for sale | $199,900-4.8%$98/sqft |
Source: RANW as distributed by MLS GRID #50289434 Report a problem | ||
| 4/3/2024 | Listing removed | -- |
Source: WIREX MLS #50285546 Report a problem | ||
| 1/4/2024 | Listed for sale | $210,000+180%$103/sqft |
Source: RANW as distributed by MLS GRID #50285546 Report a problem | ||
| 9/30/2019 | Listing removed | $895 |
Source: Prosper Fox Valley Report a problem | ||
| 9/24/2019 | Listed for rent | $895 |
Source: Prosper Fox Valley Report a problem | ||
| 9/10/2019 | Sold | $75,000$37/sqft |
Source: RANW as distributed by MLS GRID #50207862 Report a problem | ||
| 8/8/2019 | Pending sale | $75,000$37/sqft |
Source: Exit Elite Realty #50207862 Report a problem | ||
| 7/29/2019 | Listed for sale | $75,000$37/sqft |
Source: Exit Elite Realty #50207862 Report a problem | ||
Public tax history
| Year | Property taxes | Tax assessment |
|---|---|---|
| 2025 | $2,675 +10.9% | $167,900 +4.6% |
| 2024 | $2,412 -5.4% | $160,500 |
| 2023 | $2,549 +24.9% | $160,500 +67% |
| 2022 | $2,042 +4.5% | $96,100 |
| 2021 | $1,955 +2.1% | $96,100 |
| 2020 | $1,915 +2.4% | $96,100 |
| 2019 | $1,871 -11.2% | $96,100 +17.2% |
| 2018 | $2,107 +18.2% | $82,000 |
| 2017 | $1,783 +1.5% | $82,000 |
| 2016 | $1,757 -1.1% | $82,000 |
| 2015 | $1,777 +0.7% | $82,000 |
| 2014 | $1,764 -11.1% | $82,000 -10.6% |
| 2013 | $1,984 +0.4% | $91,700 |
| 2012 | $1,976 -1.7% | $91,700 |
| 2011 | $2,010 +0.3% | $91,700 |
| 2010 | $2,005 -14.6% | $91,700 -7.8% |
| 2009 | $2,348 -8.8% | $99,500 |
| 2008 | $2,574 +24.5% | $99,500 |
| 2007 | $2,068 +1.3% | $99,500 |
| 2006 | $2,042 +3.7% | $99,500 +16.6% |
| 2005 | $1,970 +0.2% | $85,300 |
| 2004 | $1,966 +1.6% | $85,300 |
| 2003 | $1,936 | $85,300 |
| 2002 | -- | $85,300 +56.5% |
| 2001 | -- | $54,500 |
| 2000 | -- | $54,500 |
Find assessor info on the county website
Monthly payment
Est. payment
Payment breakdown
Explore the cost of this home by adjusting the details. Changes won't be saved.Climate risks
Neighborhood: Central

Similar homes
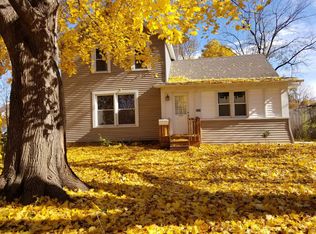
- $250,0004 bd2 ba1.6k sqft1412 N Durkee St, Appleton, WI 54911For Sale
 MLS ID #50329569, Julie Artus. RANW as distributed by MLS GRID
- $244,9003 bd3 ba2.4k sqft108 E Atlantic St, Appleton, WI 54911For Sale
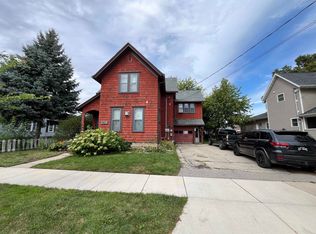 MLS ID #50332742, Chris M Michala. RANW as distributed by MLS GRID
- $229,9004 bd2 ba2.1k sqft802 S Memorial Dr, Appleton, WI 54911For Sale
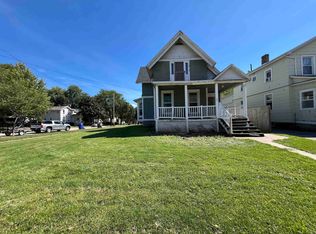 MLS ID #50333873, Chris M Michala. RANW as distributed by MLS GRID
- $209,9003 bd2 ba1.3k sqft616 N Division St, Appleton, WI 54911For Sale
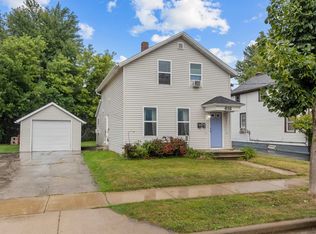 MLS ID #50334061, Caroline D Lasecki. RANW as distributed by MLS GRID
