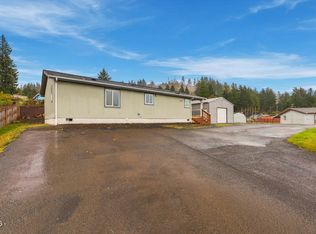
Nestled along the banks of the Nestucca River in the great Nestucca Bend neighborhood. One of the best fishing holes in the area is right outside your back door. Large mfg. home (1456 sf) with 2BR/2BA. Living Room and Family Room, Laundry room and detached garage/shop. New roof in 2010, new wood floors, new windows in 2013 with TPUD weatherization U-30. Great setting with trees, river, and mountain views. Has new vinyl siding, updated lighting, newer back deck/porch!!
For sale by owner
$375,000
18295 Nestucca Dr, Cloverdale, OR 97112
2beds
1,456sqft
Unknown
Built in 1991
-- sqft lot
$308,600 Zestimate®
$258/sqft
$15/mo HOA
What's special
Updated lightingLaundry roomNew wood floorsNew vinyl siding
What the owner loves about this home
Great house in a beautiful area with great neighbors!
- 7 days
- 205
- 11
Listed by:
Property Owner (580) 450-2716
Facts & features
Interior
Bedrooms & bathrooms
- Bedrooms: 2
- Bathrooms: 2
- Full bathrooms: 2
Heating
- Forced air
Cooling
- None
Appliances
- Included: Dishwasher, Freezer, Range / Oven, Refrigerator
Features
- Flooring: Carpet, Hardwood
- Basement: None
Interior area
- Total interior livable area: 1,456 sqft
Property
Parking
- Total spaces: 5
- Parking features: Garage - Attached, Garage - Detached, Off-street
Features
- Exterior features: Vinyl
- Has view: Yes
- View description: Water, Mountain
- Has water view: Yes
- Water view: Water
Lot
- Size: 0.28 Acres
Details
- Parcel number: 3S0931BC01100
Construction
Type & style
- Home type: Unknown
Materials
- Roof: Composition
Condition
- New construction: No
- Year built: 1991
Community & HOA
HOA
- Has HOA: Yes
- HOA fee: $15 monthly
Location
- Region: Cloverdale
Financial & listing details
- Price per square foot: $258/sqft
- Tax assessed value: $228,810
- Annual tax amount: $1,695
- Date on market: 11/10/2026
Estimated market value
$308,600
$284,000 - $330,000
Not available
Price history
| Date | Event | Price |
|---|---|---|
| 11/10/2026 | Listed for sale | $375,000+145.9%$258/sqft |
Source: Owner Report a problem | ||
| 3/25/2016 | Sold | $152,500-1.6%$105/sqft |
Source:  OCMLS #LC-75872 Report a problem | ||
| 2/9/2016 | Pending sale | $155,000$106/sqft |
Source: Windermere West LLC #15059977 Report a problem | ||
| 10/26/2015 | Price change | $155,000-6.1%$106/sqft |
Source: Windermere West LLC #15059977 Report a problem | ||
| 10/2/2015 | Listed for sale | $165,000$113/sqft |
Source: Windermere West LLC #15059977 Report a problem | ||
| 9/19/2015 | Pending sale | $165,000$113/sqft |
Source: Windermere West LLC #15059977 Report a problem | ||
| 7/8/2015 | Listed for sale | $165,000+79.3%$113/sqft |
Source: Windermere West - Pacific City #15059977 Report a problem | ||
| 3/16/2005 | Sold | $92,000$63/sqft |
Source: Public Record Report a problem | ||
Public tax history
| Year | Property taxes | Tax assessment |
|---|---|---|
| 2025 | $1,695 +5.8% | $144,500 +3% |
| 2024 | $1,602 +0.7% | $140,300 +3% |
| 2023 | $1,591 +3.8% | $136,220 +3% |
| 2022 | $1,532 +3% | $132,260 +3% |
| 2021 | $1,488 +2.5% | $128,410 +3% |
| 2020 | $1,452 +2.2% | $124,670 +3% |
| 2019 | $1,421 +9% | $121,040 +3% |
| 2018 | $1,304 | $117,520 +3% |
| 2017 | $1,304 +15.2% | $114,100 +3% |
| 2016 | $1,132 | $110,780 +3% |
| 2015 | $1,132 +2% | $107,560 +3% |
| 2014 | $1,109 +2.5% | $104,430 +3% |
| 2013 | $1,083 +7.3% | $101,390 +3% |
| 2012 | $1,009 -4.2% | $98,440 +3% |
| 2011 | $1,053 +2.9% | $95,580 +3% |
| 2010 | $1,024 +1.6% | $92,800 +3% |
| 2009 | $1,008 | $90,100 +136.5% |
| 2007 | -- | $38,090 +3% |
| 2006 | -- | $36,990 +3.2% |
| 2005 | -- | $35,840 +3% |
| 2004 | -- | $34,800 -51.1% |
| 2001 | -- | $71,165 +3% |
| 2000 | $776 | $69,092 |
Find assessor info on the county website
Monthly payment
Est. payment
Payment breakdown
Explore the cost of this home by adjusting the details. Changes won't be saved.Climate risks
Neighborhood: 97112
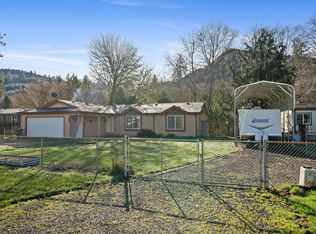


Similar homes
- $465,0002 bd2 ba1.2k sqft43305 Little Nestucca River Rd, Cloverdale, OR 97112For Sale
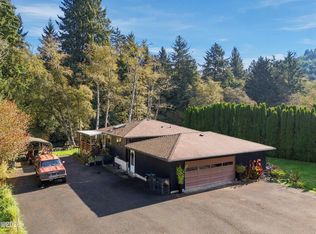
 MLS ID #26-2807, Amy Graham, Taylor & Taylor Realty Company. OCMLS
- $--3 bd2 ba1.6k sqft215 N Deer Dr, Otis, OR 97368Auction
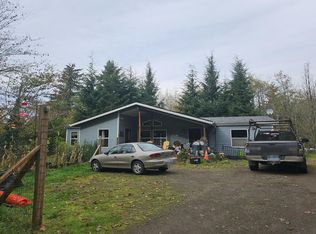 Auction.com 2
- $389,9953 bd2 ba1.6k sqft533 N Yodel Ln, Otis, OR 97368For Sale
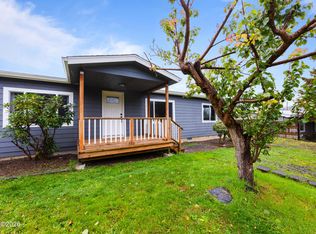 MLS ID #26-2901, Nicole Johnson, Realty One Group At the Beach,. OCMLS
- $399,0002 bd2 ba1.3k sqft440 N Pleasure Dr, Otis, OR 97368For Sale
 MLS ID #26-2889, Shelli R. Neal, Realty One Group At the Beach,. OCMLS
- $370,0003 bd3 ba1.4k sqft4805 Leonard St W, Tillamook, OR 97141For SaleMLS ID #TC-22627, Jacob Torres Mata - Team Torres, Real Broker. OCMLS
- $450,0002 bd2 ba1k sqft5900 Coates Ave, Cloverdale, OR 97112For SaleMLS ID #26-927, Jacqueline L Voegeli, Windermere West LLC, Pacific City. OCMLS
- $419,0003 bd3 ba1.5k sqft701 Nestucca Ave, Tillamook, OR 97141For SaleMLS ID #26-2910, Marilyn K. Hankins, King Realty. OCMLS
- $399,9003 bd1 ba1.8k sqft25555 Blaine Rd, Beaver, OR 97108For SaleMLS ID #26-2116, Patricia Lynn Tippett, King Realty. OCMLS
- $319,0002 bd2 ba1k sqft906 N River Bend Rd, Otis, OR 97368For SaleMLS ID #26-2914, Sarah C Rothschild, Coldwell Banker Professional Group - Lincoln City. OCMLS
- $375,0003 bd2 ba1.7k sqft14560 Wilson River Hwy, Tillamook, OR 97141For SaleMLS ID #26-2626, Stephanie L. Poppe, Rob Trost Real Estate - Tillam. OCMLS
- $370,0003 bd2 ba1.2k sqft508 Evergreen Dr, Tillamook, OR 97141For SaleMLS ID #26-2781, Stephanie L. Poppe, Rob Trost Real Estate - Tillam. OCMLS
- $425,0002 bd2 ba1.4k sqft34885 Cape Kiwanda Dr, Pacific City, OR 97135For SaleMLS ID #26-2824, Amy Graham, Taylor & Taylor Realty Company. OCMLS
- $510,0002 bd2 ba1.2k sqft35300 Rueppell Ave, Cloverdale, OR 97112For SaleMLS ID #26-2574, Seth Belsey, Harcourts Coast Realty. OCMLS
- $385,0002 bd2 ba1.2k sqft1025 Wilson River Loop, Tillamook, OR 97141For SaleMLS ID #26-859, Marilyn K. Hankins, King Realty. OCMLS
- $374,0003 bd1 ba1k sqft6670 Seattle Ave, Bay City, OR 97107For SaleMLS ID #TC-22520, Jennifer N Strohmaier, Rob Trost Real Estate - Tillam. OCMLS
- $374,5002 bd1 ba1.8k sqft405 Miller Ave, Tillamook, OR 97141For SaleMLS ID #26-2684, Juli Blaser Sagar, Premiere Property Group, LLC (Newport). OCMLS
- $389,4993 bd3 ba2.1k sqft801 Ash Ave, Tillamook, OR 97141For SaleMLS ID #26-2469, Cyndi G Lewis, Rob Trost Real Estate, LLC. OCMLS
- $359,0003 bd1 ba1.2k sqft1203 3rd St, Tillamook, OR 97141For SaleMLS ID #26-2829, Jennifer N Strohmaier, Rob Trost Real Estate - Tillam. OCMLS
- $370,0003 bd3 ba1.4k sqft4805 Leonard St W, Tillamook, OR 97141Active
 MLS ID #644054441, Jacob Torres, Real Broker. RMLS (OR)
