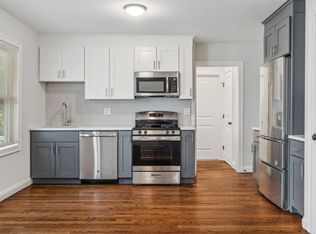
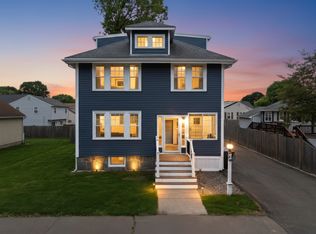
Prime Hospital Hill location in Quincy, ideally located approximately 0.5 miles from Quincy Center and the Red Line, with convenient access to Boston and close to local restaurants, shopping, and entertainment! This turnkey 4-unit multifamily offers four spacious 2-bedroom, 1-bath units and strong income potential, generating over $126K in revenue—an excellent opportunity for investors or owner-occupants. All four units have been thoughtfully updated with hardwood flooring, stainless steel appliances, central A/C, in-unit washer and dryer, and private decks, creating comfortable and desirable living spaces. Additional highlights include six off-street parking spaces, a generous yard, and common basement storage. A rare opportunity to own a well-maintained income-producing property in one of Quincy’s most convenient locations.
For sale
$1,680,000
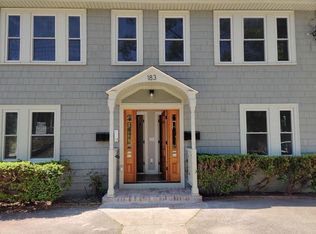
183 Whitwell St, Quincy, MA 02169
8beds
3,200sqft
4 Family
Built in 1925
-- sqft lot
$-- Zestimate®
$525/sqft
$-- HOA
What's special
Private decksGenerous yardIn-unit washer and dryerHardwood flooringStainless steel appliancesSix off-street parking spaces
- 46 days
- 214
- 12
Zillow last checked:
Listing updated:
Listed by:
Rose Hall 857-207-7579,
Blue Ocean Realty, LLC 617-206-5700,
KeyKuen Ho
Source: MLS PIN,MLS#: 73582139
Facts & features
Interior
Bedrooms & bathrooms
- Bedrooms: 8
- Bathrooms: 4
- Full bathrooms: 4
Heating
- Forced Air, Natural Gas
Cooling
- Central Air
Appliances
- Included: Dishwasher, Washer, Dryer
Features
- Flooring: Tile, Hardwood
- Basement: Full
- Has fireplace: No
Interior area
- Total structure area: 3,200
- Total interior livable area: 3,200 sqft
- Finished area above ground: 3,200
Property
Parking
- Total spaces: 6
- Parking features: Paved Drive, Off Street, Paved
- Uncovered spaces: 6
Features
- Patio & porch: Deck
- Waterfront features: Ocean
Lot
- Size: 6,011 Square Feet
Details
- Parcel number: M:1184 B:7 L:19, 176412,176412
- Zoning: RESB
Construction
Type & style
- Home type: MultiFamily
- Property subtype: 4 Family
Materials
- Foundation: Other
Condition
- Year built: 1925
Utilities & green energy
- Sewer: Public Sewer
- Water: Public
Community & HOA
Community
- Features: Public Transportation, Shopping, Park, Golf, Highway Access, House of Worship, Private School, Public School, T-Station, University
Location
- Region: Quincy
Financial & listing details
- Price per square foot: $525/sqft
- Tax assessed value: $1,206,500
- Annual tax amount: $13,911
- Date on market: 9/25/2026
- Total actual rent: 10500
Estimated market value
Not available
Estimated sales range
Not available
$2,369/mo
Price history
| Date | Event | Price |
|---|---|---|
| 9/24/2026 | Listed for sale | $1,680,000$525/sqft |
Source: MLS PIN #73582139 Report a problem | ||
| 8/2/2026 | Listing removed | $1,680,000$525/sqft |
Source: MLS PIN #73529392 Report a problem | ||
| 6/3/2026 | Listed for sale | $1,680,000$525/sqft |
Source: MLS PIN #73529392 Report a problem | ||
| 5/4/2026 | Listing removed | $1,680,000$525/sqft |
Source: MLS PIN #73509973 Report a problem | ||
| 4/29/2026 | Listed for sale | $1,680,000+8.4%$525/sqft |
Source: MLS PIN #73509973 Report a problem | ||
| 11/5/2024 | Sold | $1,550,000-3.1%$484/sqft |
Source: MLS PIN #73282126 Report a problem | ||
| 8/27/2024 | Listed for sale | $1,599,999+166.7%$500/sqft |
Source: MLS PIN #73282126 Report a problem | ||
| 10/6/2020 | Listing removed | $2,000$1/sqft |
Source: Zillow Rental Manager Report a problem | ||
| 9/24/2020 | Listed for rent | $2,000$1/sqft |
Source: Zillow Rental Manager Report a problem | ||
| 10/31/2019 | Sold | $600,000$188/sqft |
Source: Public Record Report a problem | ||
Public tax history
| Year | Property taxes | Tax assessment |
|---|---|---|
| 2025 | $13,911 +27.6% | $1,206,500 +24.7% |
| 2024 | $10,906 +8.5% | $967,700 +7.1% |
| 2023 | $10,053 -2.1% | $903,200 +5.4% |
| 2022 | $10,266 +34% | $856,900 +35.8% |
| 2021 | $7,660 +1.6% | $631,000 +4% |
| 2020 | $7,543 +4.8% | $606,800 +5.8% |
| 2019 | $7,195 -2.9% | $573,300 +3.2% |
| 2018 | $7,412 +2.4% | $555,600 +8.7% |
| 2017 | $7,239 +9.8% | $510,900 +11.3% |
| 2016 | $6,591 +1.4% | $459,000 +3.1% |
| 2015 | $6,503 +2% | $445,400 +3.8% |
| 2014 | $6,373 -3.8% | $428,900 -6.1% |
| 2013 | $6,622 +1.3% | $456,700 -3.9% |
| 2012 | $6,537 -0.5% | $475,400 -2.9% |
| 2011 | $6,568 +5.7% | $489,400 +4.1% |
| 2010 | $6,213 -1.4% | $470,000 -6.1% |
| 2009 | $6,304 +9.5% | $500,300 -5.9% |
| 2008 | $5,757 +0.7% | $531,600 -2.9% |
| 2007 | $5,716 +4.5% | $547,500 +3.4% |
| 2006 | $5,469 +2.8% | $529,400 +7.8% |
| 2005 | $5,321 +10.9% | $490,900 +28.5% |
| 2004 | $4,799 +19% | $382,100 +29% |
| 2003 | $4,034 +5.4% | $296,200 +23.4% |
| 2001 | $3,827 +32% | $240,100 +26.2% |
| 1999 | $2,899 | $190,200 |
Find assessor info on the county website
Monthly payment
Est. payment
Payment breakdown
Explore the cost of this home by adjusting the details. Changes won't be saved.Climate risks
Neighborhood: 02169


Similar homes
- $1,895,0006 bd6 ba3.9k sqft74-76 Butler Rd, Quincy, MA 02169For Sale
 MLS ID #73575244, Benjamin Lincoln, Compass. MLS PIN
- $1,800,0009 bd6 ba3.3k sqft24 Buttonwood St, Dorchester, MA 02125For Sale
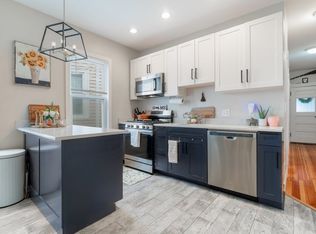 MLS ID #73577184, Mission Realty Advisors, Compass. MLS PIN
- $1,620,0009 bd3 ba3.2k sqft24 Vassar St, Dorchester, MA 02121For Sale
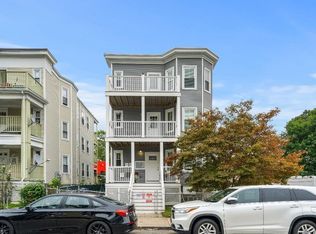 MLS ID #73580390, Jonathan Minerick, homecoin.com. MLS PIN
- $1,100,0005 bd3 ba1.9k sqft11 Conrad St, Quincy, MA 02169For Sale
 MLS ID #73536087, Alexa Holmes, eXp Realty LLC - Corporate Office. MLS PIN
