A beautiful, clean 2 bedroom house with a fenced yard and a 2 car detached garage with a privacy fence back yard. Land contract or a lease option to buy is available. This house could be a cash flowing rental as well.
Active
$98,200
18820 Norborne, Redford, MI 48240
2beds
764sqft
Single Family Residence
Built in 1924
5,227 Square Feet Lot
$79,300 Zestimate®
$129/sqft
$-- HOA
What's special
Fenced yard
- 2 hours
- 39
- 4
Zillow last checked:
Listing updated:
Listed by:
George Petrentzev 248-275-8414,
George Petrentzev 248-275-8414
Source: MichRIC,MLS#: 26059612
Facts & features
Interior
Bedrooms & bathrooms
- Bedrooms: 2
- Bathrooms: 1
- Full bathrooms: 1
- Main level bedrooms: 2
Primary bedroom
- Area: 100
- Dimensions: 10.00 x 10.00
Bedroom 2
- Area: 100
- Dimensions: 10.00 x 10.00
Bathroom 1
- Area: 100
- Dimensions: 10.00 x 10.00
Kitchen
- Area: 150
- Dimensions: 10.00 x 15.00
Living room
- Area: 225
- Dimensions: 15.00 x 15.00
Heating
- Forced Air
Cooling
- Central Air
Appliances
- Laundry: Main Level
Features
- Ceiling Fan(s)
- Flooring: Linoleum, Wood
- Windows: Insulated Windows
- Basement: Crawl Space
- Has fireplace: No
Interior area
- Total structure area: 764
- Total interior livable area: 764 sqft
Property
Parking
- Total spaces: 2
- Parking features: Detached, Garage Door Opener
- Garage spaces: 2
Features
- Stories: 1
- Fencing: Chain Link,Privacy,Vinyl
Lot
- Size: 5,227 Square Feet
- Dimensions: 55 x 100
Details
- Parcel number: 79007010145000
Construction
Type & style
- Home type: SingleFamily
- Architectural style: Ranch
- Property subtype: Single Family Residence
Materials
- Vinyl Siding
- Roof: Asphalt
Condition
- New construction: No
- Year built: 1924
Utilities & green energy
- Sewer: Public Sewer
- Water: Public
Community & HOA
Location
- Region: Redford
Financial & listing details
- Price per square foot: $129/sqft
- Tax assessed value: $22,469
- Date on market: 11/11/2026
- Listing terms: Cash,FHA,Lease Option,Contract,Conventional
Estimated market value
$79,300
$73,000 - $86,000
$1,124/mo
Price history
| Date | Event | Price |
|---|---|---|
| 11/11/2026 | Listed for sale | $98,200+23.6%$129/sqft |
Source:  MichRIC #26059612 Report a problem | ||
| 8/20/2026 | Sold | $79,480-11.6%$104/sqft |
Source:  Realcomp II #20261059963 Report a problem | ||
| 7/31/2026 | Listed for sale | $89,900$118/sqft |
Source: Realcomp II #20261059963 Report a problem | ||
| 7/31/2026 | Listing removed | $89,900$118/sqft |
Source: Realcomp II #20261035190 Report a problem | ||
| 5/15/2026 | Listed for sale | $89,900$118/sqft |
Source: Realcomp II #20261035190 Report a problem | ||
| 5/15/2026 | Listing removed | $89,900$118/sqft |
Source: Realcomp II #20261025619 Report a problem | ||
| 4/17/2026 | Listed for sale | $89,900+1423.7%$118/sqft |
Source: Realcomp II #20261025619 Report a problem | ||
| 4/3/2026 | Listing removed | $1,285$2/sqft |
Source: Zillow Rentals Report a problem | ||
| 2/24/2026 | Listed for rent | $1,285$2/sqft |
Source: Zillow Rentals Report a problem | ||
| 12/16/2008 | Sold | $5,900-91.1%$8/sqft |
Source: Public Record Report a problem | ||
| 12/28/2006 | Sold | $66,062+78.5%$86/sqft |
Source: Public Record Report a problem | ||
| 8/5/1997 | Sold | $37,000$48/sqft |
Source: Public Record Report a problem | ||
Public tax history
| Year | Property taxes | Tax assessment |
|---|---|---|
| 2025 | -- | $51,900 +32.7% |
| 2024 | -- | $39,100 +15.3% |
| 2023 | -- | $33,900 +9.7% |
| 2022 | -- | $30,900 +20.2% |
| 2021 | -- | $25,700 |
| 2020 | $1,655 +15.2% | $25,700 +7.5% |
| 2019 | $1,436 | $23,900 +34.3% |
| 2018 | $1,436 | $17,800 +3.5% |
| 2017 | -- | $17,200 -0.6% |
| 2016 | $1,729 | $17,300 +8.8% |
| 2015 | $1,729 +10.1% | $15,900 -2.5% |
| 2013 | $1,570 -9.2% | $16,300 -10.9% |
| 2012 | $1,729 | $18,300 -14.5% |
| 2011 | -- | $21,400 -27.9% |
| 2009 | -- | $29,700 -18% |
| 2008 | -- | $36,200 -9.5% |
| 2007 | -- | $40,000 +7.8% |
| 2005 | $352 | $37,100 +34.4% |
| 2003 | -- | $27,600 +50.9% |
| 2001 | $723 -5.9% | $18,290 +3.2% |
| 2000 | $768 | $17,723 |
Find assessor info on the county website
Monthly payment
Est. payment
Payment breakdown
Explore the cost of this home by adjusting the details. Changes won't be saved.Climate risks
Neighborhood: 48240
Similar homes
- $119,9003 bd1 ba858 sqft18852 Indian, Redford, MI 48240For Sale
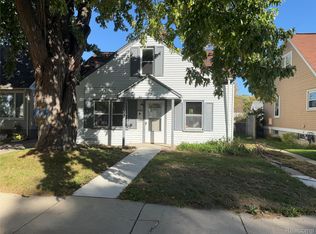
 MLS ID #20261083229, Mike Weinraub, Vantage Realty Group. Realcomp II
- $103,0003 bd1 ba908 sqft22450 Ray St, Detroit, MI 48223For Sale
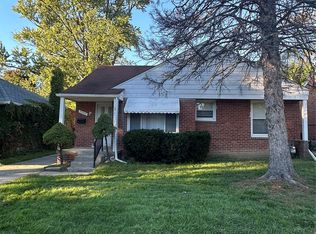 MLS ID #20261077528, Lori A Tooles, Prime Financial Plus Realty. Realcomp II
- $89,9003 bd1 ba952 sqft18556 Kentfield St, Detroit, MI 48219For Sale
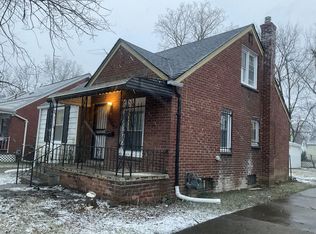
 MLS ID #26054822, Kristian Freiwald, Domus Realty. MichRIC
- $95,0003 bd1 ba1.1k sqft15375 Asbury Park, Detroit, MI 48227For Sale
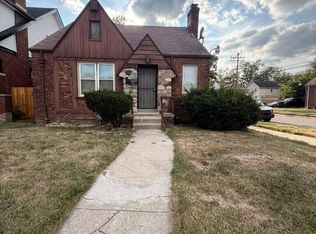 MLS ID #26055080, Kristian Freiwald, Domus Realty. MichRIC
- $59,9002 bd1 ba728 sqft18459 Kentfield St, Detroit, MI 48219For SaleMLS ID #26058796, Alana Paap, Investor's Prop Mgmt Detroit. MichRIC
- $85,0003 bd1 ba879 sqft19035 Fielding St, Detroit, MI 48219For SaleMLS ID #20261077288, David Rabior, Clyde Realty LLC. Realcomp II
- $90,0003 bd1 ba972 sqft20065 Southfield Rd, Detroit, MI 48235For SaleMLS ID #20261080284, Mellisa Mallory, EXP Realty Main. Realcomp II
- $109,9992 bd1 ba883 sqft21203 Doepfer Rd, Warren, MI 48091For SaleMLS ID #20261087791, Brock House, KW Metro. Realcomp II
- $94,9003 bd1 ba1k sqft19400 Sunderland Rd, Detroit, MI 48219For SaleMLS ID #20261034181, Al D Lucy, Develop Detroit Realty & Construction Group. Realcomp II
- $84,9003 bd1 ba1k sqft16101 Bramell St, Detroit, MI 48219For SaleMLS ID #20261055839, Mark Poloney, RE/MAX First. Realcomp II
- $99,0003 bd1 ba1k sqft19974 Charest St, Detroit, MI 48234For SaleMLS ID #20261088364, Ashley Najarian, RE/MAX Dream Properties. Realcomp II
- $69,9002 bd1 ba732 sqft18285 Codding St, Detroit, MI 48219For SaleMLS ID #26046641, Kristian Freiwald, Domus Realty. MichRIC
- $99,0003 bd2 ba900 sqft548 Lenoir Ave, River Rouge, MI 48218For SaleMLS ID #20261089477, Jeanette C Lucy, IQ Properties LLC. Realcomp II
- $75,0003 bd1 ba960 sqft19325 Grandville Ave, Detroit, MI 48219For SaleMLS ID #20261084820, Ligia M Godoy, CMB Real Estate. Realcomp II
- $89,9003 bd1 ba912 sqft27017 Florence St, Inkster, MI 48141For SaleMLS ID #20261087081, Joseph Hammel, Keller Williams Somerset. Realcomp II
- $99,9002 bd1 ba732 sqft309 Michigan Ave, Pontiac, MI 48342For SaleMLS ID #20261083429, James White Sr, 3DX Real Estate LLC Troy. Realcomp II
- $129,0003 bd1 ba950 sqft8708 Jewett Ave, Warren, MI 48089For Sale
 MLS ID #50227092, Robert Kluck, Professional Leasing & Sales LLC. MiRealSource
- $104,9002 bd1 ba720 sqft1865 Hanford Ave, Lincoln Park, MI 48146For SaleMLS ID #20261085933, Tim Muflihi, RE/MAX Team 2000. Realcomp II
- $95,0002 bd2 ba817 sqft7620 Woodview St APT 1, Westland, MI 48185For SaleMLS ID #20261088208, Bridget Cassar, Century 21 Dynamic Realty. Realcomp II
