This 3055 square foot single family home has 4 bedrooms and 2.5 bathrooms. This home is located at 19527 Lockridge Dr, Spring, TX 77373.
Foreclosed
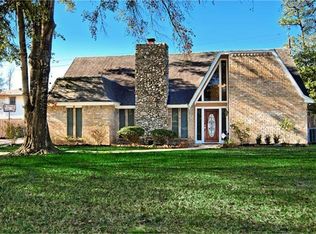
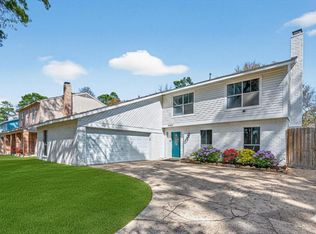
Street View
Est. $293,600
19527 Lockridge Dr, Spring, TX 77373
4beds
2baths
3,055sqft
SingleFamily
Built in 1972
0.31 Acres Lot
$293,600 Zestimate®
$96/sqft
$3/mo HOA
Overview
- 42 days |
- 25 |
- 0 |
Facts & features
Interior
Bedrooms & bathrooms
- Bedrooms: 4
- Bathrooms: 2.5
Heating
- Other
Cooling
- Central
Features
- Has fireplace: Yes
- Fireplace features: masonry
Interior area
- Total interior livable area: 3,055 sqft
Property
Parking
- Total spaces: 1
- Parking features: Garage - Detached
Features
- Exterior features: Brick
Lot
- Size: 0.31 Acres
Details
- Parcel number: 1015480000434
Construction
Type & style
- Home type: SingleFamily
Materials
- brick
- Foundation: Slab
Condition
- Year built: 1972
Community & HOA
HOA
- Has HOA: Yes
- HOA fee: $3 monthly
Location
- Region: Spring
Financial & listing details
- Price per square foot: $96/sqft
- Tax assessed value: $324,805
- Annual tax amount: $355
Visit our professional directory to find a foreclosure specialist in your area that can help with your home search.
Find a foreclosure agentForeclosure details
Estimated market value
$293,600
$270,000 - $320,000
$2,461/mo
Price history
| Date | Event | Price |
|---|---|---|
| 5/14/2026 | Sold | -- |
Source: Public Record Report a problem | ||
Public tax history
| Year | Property taxes | Tax assessment |
|---|---|---|
| 2025 | $355 +11.1% | $324,805 +3.2% |
| 2024 | $319 +22.9% | $314,656 +2.3% |
| 2023 | $260 +11.9% | $307,552 +10% |
| 2022 | $232 | $279,548 +14.2% |
| 2021 | -- | $244,749 +18.7% |
| 2020 | $200 -20.5% | $206,149 -1.5% |
| 2019 | $251 -84% | $209,264 -2.7% |
| 2018 | $1,570 | $215,151 |
| 2017 | $1,570 +5.5% | $215,151 +11.9% |
| 2016 | $1,487 -13.4% | $192,310 |
| 2015 | $1,717 | $192,310 +2.8% |
| 2014 | $1,717 | $187,044 +16.2% |
| 2013 | -- | $160,931 -5.9% |
| 2012 | -- | $170,959 |
| 2011 | -- | $170,959 +1.4% |
| 2010 | -- | $168,526 -2.9% |
| 2009 | -- | $173,512 -6.6% |
| 2007 | -- | $185,776 +11.3% |
| 2006 | -- | $166,900 |
| 2005 | -- | $166,900 |
| 2004 | -- | $166,900 +6.9% |
| 2003 | -- | $156,100 |
| 2002 | -- | $156,100 +1.9% |
| 2001 | -- | $153,200 +10% |
| 2000 | -- | $139,300 |
Find assessor info on the county website
Monthly payment
Estimated monthly payment$1,822
All calculations are estimates and provided by Zillow, Inc. for informational purposes only. Actual amounts may vary.
HOA fees may include property taxes on listings classified as Co-Ops. Contact the listing agent and/or owner for fee details.
Mortgage interest rates are dependent on a number of factors, including credit score, down payment, and repayment length. Interest rate data provided by Zillow Group Marketplace, Inc. as of 1/1/1970 from various mortgage lenders with which we have lead or other similar arrangements; the Estimated Payment is an average of those rates.
See how much you could borrow to make a competitive offer.
Climate risks
Neighborhood: North Hill Estate
Nearby schools
GreatSchools rating
- 6/10Ginger McNabb Elementary SchoolGrades: PK-5Distance: 0.4 mi
- 4/10Twin Creeks Middle SchoolGrades: 6-8Distance: 1.9 mi
- 2/10Spring High SchoolGrades: 9-12Distance: 0.2 mi


- Texas
- Harris County
- Spring
- 77373
- North Hill Estate
- 19527 Lockridge Dr
Nearby cities
Nearby neighborhoods
Nearby zip codes
Other Spring Topics
