Great opportunity in Gary! This home features two bedrooms and one bathroom on the main level, plus a walkout basement offering additional space and potential. The basement includes an additional bedroom and bathroom area. The basement bathroom is in need of repair. Property offers plenty of opportunity for an owner-occupant or investor to make it their own. Schedule your showing today!
Active
$99,900
2028 Massachusetts St, Gary, IN 46407
3beds
1,800sqft
Single Family Residence
Built in 1952
5,009 Square Feet Lot
$-- Zestimate®
$56/sqft
$-- HOA
What's special
- 33 days
- 280
- 29
Zillow last checked:
Listing updated:
Listed by:
Jared Gomez,
Listing Leaders 219-462-5478
Source: NIRA as distributed by MLS GRID,MLS#: 845389
Facts & features
Interior
Bedrooms & bathrooms
- Bedrooms: 3
- Bathrooms: 2
- Full bathrooms: 2
Rooms
- Room types: Primary Bedroom
Primary bedroom
- Level: Main
- Area: 0
- Dimensions: 0.0 x 0.0
Heating
- Forced Air
Appliances
- Included: None
Features
- None
- Basement: Full,Walk-Out Access
- Has fireplace: No
Interior area
- Total structure area: 1,800
- Total interior livable area: 1,800 sqft
- Finished area above ground: 900
Property
Parking
- Parking features: Alley Access
Features
- Levels: One
- Pool features: None
- Fencing: Partial
- Has view: Yes
- View description: Neighborhood
Lot
- Size: 5,009 Square Feet
- Features: Back Yard, Front Yard
Details
- Parcel number: 450810355016000004
- Special conditions: None
Construction
Type & style
- Home type: SingleFamily
- Property subtype: Single Family Residence
Condition
- Fixer
- New construction: No
- Year built: 1952
Utilities & green energy
- Electric: 100 Amp Service
- Sewer: Public Sewer
- Water: Public
- Utilities for property: Electricity Connected, Water Connected, Sewer Connected, Natural Gas Connected
Community & HOA
Community
- Subdivision: Pridmore Orr & Ulrich
HOA
- Has HOA: No
Location
- Region: Gary
Financial & listing details
- Price per square foot: $56/sqft
- Tax assessed value: $66,300
- Annual tax amount: $1,663
- Date on market: 9/16/2026
- Listing agreement: Exclusive Right To Sell
- Listing terms: Cash,Conventional
Estimated market value
Not available
Estimated sales range
Not available
$1,600/mo
Price history
| Date | Event | Price |
|---|---|---|
| 9/16/2026 | Listed for sale | $99,900+471.5%$56/sqft |
Source:  NIRA as distributed by MLS GRID #845389 Report a problem | ||
| 9/5/2008 | Sold | $17,480+186.6%$10/sqft |
Source: Public Record Report a problem | ||
| 7/8/2005 | Sold | $6,100$3/sqft |
Source: Public Record Report a problem | ||
Public tax history
| Year | Property taxes | Tax assessment |
|---|---|---|
| 2025 | $1,663 +5.5% | $70,700 +6.6% |
| 2024 | $1,576 +9.1% | $66,300 +6.1% |
| 2023 | $1,444 +5.9% | $62,500 +11.4% |
| 2022 | $1,364 | $56,100 +5.8% |
| 2021 | $1,364 +27.9% | $53,000 |
| 2020 | $1,066 -28.9% | $53,000 |
| 2019 | $1,499 -2.7% | $53,000 -19.3% |
| 2018 | $1,540 +2.9% | $65,700 -1.1% |
| 2017 | $1,496 | $66,400 -5.4% |
| 2016 | $1,496 -25% | $70,200 -17.7% |
| 2014 | $1,996 +4.3% | $85,300 +0.1% |
| 2013 | $1,914 -11.5% | $85,200 -8.6% |
| 2012 | $2,162 +4.1% | $93,200 +7.6% |
| 2011 | $2,076 -4% | $86,600 |
| 2010 | $2,164 | $86,600 +49.6% |
| 2009 | -- | $57,900 +8.4% |
| 2007 | -- | $53,400 +119.8% |
| 2006 | -- | $24,300 |
| 2005 | -- | $24,300 +428.3% |
| 2001 | -- | $4,600 |
Find assessor info on the county website
Monthly payment
Est. payment
Payment breakdown
Explore the cost of this home by adjusting the details. Changes won't be saved.Climate risks
Neighborhood: Midtown

Similar homes
- $144,5005 bd2 ba1.8k sqft1517 Rhode Island St, Gary, IN 46407For Sale
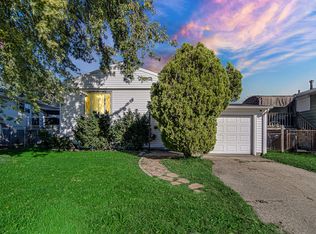
 MLS ID #846505, Amy Blanton, Better Homes and Gardens Real. NIRA as distributed by MLS GRID
- $124,9003 bd1 ba1.1k sqft2180 Massachusetts St, Gary, IN 46407For Sale
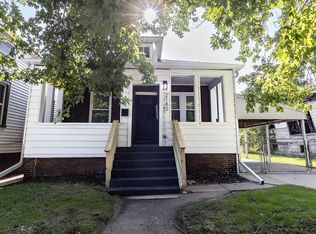 MLS ID #842504, Rebecca Olson, Listing Leaders Affiliated. NIRA as distributed by MLS GRID
- $110,0004 bd2 ba2.3k sqft4433 Vermont Ct, Gary, IN 46409For Sale
 MLS ID #845963, Yesenia Flores, Absolute Realty Solutions LLC. NIRA as distributed by MLS GRID
- $105,0002 bd1 ba975 sqft2550 Harrison St, Gary, IN 46407For Sale
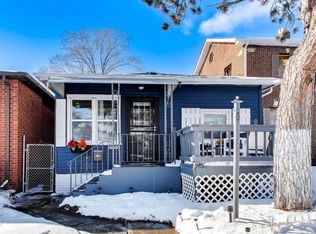 MLS ID #833671, Anne Chantos, Coldwell Banker Realty. NIRA as distributed by MLS GRID
- $129,8002 bd2 ba1.7k sqft2337 Connecticut St, Gary, IN 46407For SaleMLS ID #840920, Sabine Miller, BS Realty Services Indiana LLC. NIRA as distributed by MLS GRID
- $120,0003 bd2 ba1.1k sqft1173 Tyler St, Gary, IN 46407For SaleMLS ID #838041, Donald Deerwester III, McCormick Real Estate, Inc.. NIRA as distributed by MLS GRID
- $110,0002 bd1 ba1.1k sqft231 McKinley St, Gary, IN 46404For SaleMLS ID #846331, Johnette Gore, Premier Midwest Realty, INC. NIRA as distributed by MLS GRID
- $82,5003 bd1 ba1.3k sqft4228 Delaware St, Gary, IN 46409For SaleMLS ID #845392, Lia Dawson, Region Real Estate LLC. NIRA as distributed by MLS GRID
- $110,0003 bd1 ba1.1k sqft621 Colfax St, Gary, IN 46406For SaleMLS ID #844655, Christina Fieldhouse, @properties/Christie's Intl RE. NIRA as distributed by MLS GRID
- $82,0003 bd1 ba1.4k sqft3929 Jackson St, Gary, IN 46408For SaleMLS ID #846263, Mark Keene, BS Realty Services Indiana LLC. NIRA as distributed by MLS GRID
- $134,9003 bd1 ba1.1k sqft1014 W 19th Ave, Gary, IN 46407For SaleMLS ID #842510, Rebecca Olson, Listing Leaders Affiliated. NIRA as distributed by MLS GRID
- $124,9003 bd1 ba1.5k sqft4084 Tyler St, Gary, IN 46408For SaleMLS ID #845705, Bianca Ruvalcaba, Exit Strategy Realty. NIRA as distributed by MLS GRID
- $94,9002 bd1 ba950 sqft1302 Dakota St, Gary, IN 46403For SaleMLS ID #842775, Brittany Wolak, New Chapter Real Estate. NIRA as distributed by MLS GRID
- $125,0004 bd3 ba2.4k sqft2048 Roosevelt Pl, Gary, IN 46404For SaleMLS ID #838523, Daniel Robinson, Crosstown Real Estate, Inc.. NIRA as distributed by MLS GRID
- $124,9004 bd2 ba1.8k sqft4457 E 6th Ave, Gary, IN 46403For SaleMLS ID #843825, Jeff McCormick, McCormick Real Estate, Inc.. NIRA as distributed by MLS GRID
- $129,9003 bd2 ba1k sqft1305 E 40th Ave, Gary, IN 46409For SaleMLS ID #844376, Brian Waters, Mentor Listing Realty, Inc.. NIRA as distributed by MLS GRID
- $69,0003 bd1 ba950 sqft4030 W 22nd Plz, Gary, IN 46404For SaleMLS ID #844608, Ashley Tarver, @properties/Christie's Intl RE. NIRA as distributed by MLS GRID
- $124,9003 bd1 ba900 sqft4415 W 21st Ave, Gary, IN 46404For SaleMLS ID #840866, Rebecca Olson, Listing Leaders Affiliated. NIRA as distributed by MLS GRID
