Totally remodeled!
Speciious 3 bed room 2 bath with a Den room, newly remodeled, In a peacefull col de sac street in city of Winnetka, close to shopping centers and home depot and freeway. Spacious back yard with fruit trees.
For sale by owner
Price increase: $200K (9/27)
$1,300,000
20533 Stagg St, Winnetka, CA 91306
3beds
1,450sqft
SingleFamily
Built in 1996
7,000 Square Feet Lot
$-- Zestimate®
$897/sqft
$-- HOA
What's special
Newly remodeled
- 22 days
- 396
- 16
Listed by:
Property Owner (818) 676-9296
Facts & features
Interior
Bedrooms & bathrooms
- Bedrooms: 3
- Bathrooms: 2
- Full bathrooms: 1
- 3/4 bathrooms: 1
Heating
- Other
Interior area
- Total interior livable area: 1,450 sqft
Property
Parking
- Total spaces: 1
- Parking features: Garage
Lot
- Size: 7,000 Square Feet
Details
- Parcel number: 2108023010
Construction
Type & style
- Home type: SingleFamily
- Architectural style: Conventional
Condition
- New construction: No
- Year built: 1996
Community & HOA
Location
- Region: Winnetka
Financial & listing details
- Price per square foot: $897/sqft
- Tax assessed value: $516,455
- Date on market: 9/26/2026
Estimated market value
Not available
Estimated sales range
Not available
$3,386/mo
Price history
| Date | Event | Price |
|---|---|---|
| 9/27/2026 | Price change | $1,300,000+18.2%$897/sqft |
Source: Owner Report a problem | ||
| 9/26/2026 | Listed for sale | $1,100,000+147.2%$759/sqft |
Source: Owner Report a problem | ||
| 9/11/2026 | Listing removed | $4,399$3/sqft |
Source: Zillow Rentals Report a problem | ||
| 1/11/2026 | Price change | $4,399+10%$3/sqft |
Source: Zillow Rentals Report a problem | ||
| 11/17/2025 | Price change | $3,999-2.4%$3/sqft |
Source: Zillow Rentals Report a problem | ||
| 11/9/2025 | Price change | $4,099-2.4%$3/sqft |
Source: Zillow Rentals Report a problem | ||
| 10/26/2025 | Price change | $4,199-2.3%$3/sqft |
Source: Zillow Rentals Report a problem | ||
| 10/22/2025 | Price change | $4,299-4.4%$3/sqft |
Source: Zillow Rentals Report a problem | ||
| 10/17/2025 | Price change | $4,499+4.7%$3/sqft |
Source: Zillow Rentals Report a problem | ||
| 10/14/2025 | Price change | $4,299-2.3%$3/sqft |
Source: Zillow Rentals Report a problem | ||
| 10/9/2025 | Price change | $4,399-2.2%$3/sqft |
Source: Zillow Rentals Report a problem | ||
| 10/7/2025 | Price change | $4,499+2.3%$3/sqft |
Source: Zillow Rentals Report a problem | ||
| 10/2/2025 | Price change | $4,399-4.3%$3/sqft |
Source: Zillow Rentals Report a problem | ||
| 9/17/2025 | Price change | $4,599+4.5%$3/sqft |
Source: Zillow Rentals Report a problem | ||
| 9/14/2025 | Price change | $4,399-2.2%$3/sqft |
Source: Zillow Rentals Report a problem | ||
| 8/27/2025 | Price change | $4,499+7.1%$3/sqft |
Source: Zillow Rentals Report a problem | ||
| 8/4/2025 | Price change | $4,199-2.3%$3/sqft |
Source: Zillow Rentals Report a problem | ||
| 7/31/2025 | Price change | $4,299-1.2%$3/sqft |
Source: Zillow Rentals Report a problem | ||
| 7/18/2025 | Price change | $4,350-1.1%$3/sqft |
Source: Zillow Rentals Report a problem | ||
| 6/20/2025 | Price change | $4,399-2.2%$3/sqft |
Source: Zillow Rentals Report a problem | ||
| 5/31/2025 | Price change | $4,499+2.3%$3/sqft |
Source: Zillow Rentals Report a problem | ||
| 5/29/2025 | Price change | $4,399-4.3%$3/sqft |
Source: Zillow Rentals Report a problem | ||
| 5/25/2025 | Price change | $4,599-2.1%$3/sqft |
Source: Zillow Rentals Report a problem | ||
| 5/14/2025 | Price change | $4,699+4.4%$3/sqft |
Source: Zillow Rentals Report a problem | ||
| 4/28/2025 | Listed for rent | $4,499$3/sqft |
Source: Zillow Rentals Report a problem | ||
| 12/29/2017 | Sold | $445,000+9.9%$307/sqft |
Source: Public Record Report a problem | ||
| 3/4/2014 | Sold | $405,000$279/sqft |
Source: Public Record Report a problem | ||
Public tax history
| Year | Property taxes | Tax assessment |
|---|---|---|
| 2026 | -- | $516,455 +2% |
| 2025 | $6,328 +1.1% | $506,329 +2% |
| 2024 | $6,260 +1.9% | $496,402 +2% |
| 2023 | $6,142 +4.8% | $486,670 +2% |
| 2022 | $5,860 +1.3% | $477,128 +2% |
| 2021 | $5,786 -1% | $467,773 +1% |
| 2020 | $5,842 | $462,977 +2% |
| 2019 | $5,842 +6.3% | $453,900 +2% |
| 2018 | $5,495 | $445,000 +4% |
| 2017 | $5,495 +4.2% | $427,776 +2% |
| 2016 | $5,272 +2.4% | $419,390 +1.5% |
| 2015 | $5,148 +47.8% | $413,091 +47.8% |
| 2014 | $3,483 | $279,546 +2.5% |
| 2012 | -- | $272,827 +2% |
| 2011 | -- | $267,479 +0.8% |
| 2010 | -- | $265,481 -0.2% |
| 2009 | -- | $266,112 +2% |
| 2008 | -- | $260,895 +2% |
| 2007 | -- | $255,781 +2% |
| 2006 | -- | $250,766 |
| 2005 | -- | $250,766 +4% |
| 2004 | -- | $241,031 +1.9% |
| 2003 | -- | $236,615 +7.9% |
| 2002 | -- | $219,300 +41% |
| 2000 | -- | $155,500 |
Find assessor info on the county website
Monthly payment
Est. payment
Payment breakdown
Explore the cost of this home by adjusting the details. Changes won't be saved.Climate risks
Neighborhood: Winnetka


Similar homes
- $1,150,0003 bd2 ba1.8k sqft20254 Leadwell St, Winnetka, CA 91306For Sale
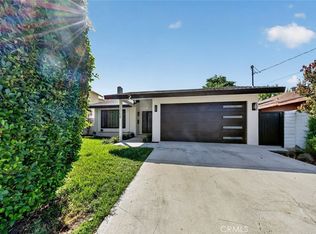 MLS ID #SR26222484, Ani Barseghyan, JohnHart Real Estate. CRMLS
- $--4 bd2 ba1.5k sqft20634 Lemay St, Winnetka, CA 91306Auction
 Auction.com 2
- $1,249,0004 bd4 ba2k sqft19700 Lull St, Winnetka, CA 91306For Sale
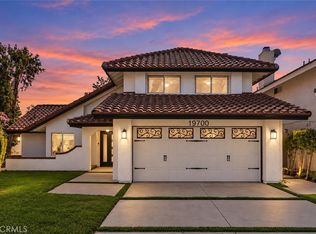 MLS ID #OC26196498, Katie Bayliss, All In Realty. CRMLS
- $--3 bd2 ba1.3k sqft8853 Oso Ave, Winnetka, CA 91306Auction
 Auction.com 2
Local buyer's agents are ready to help
