New construction home (still in the process of being finished with attached 2 car garage is situated on the Corner of West Michael Street and Coffin Street, Fremont, Indiana. Open concept and has a laundry/mud room. High efficient furnace (natural gas), central air, natural gas on demand hot water heater, water softener and Fremont City utilities. Roughly 1375 square feet of living space PLUS attached 2 car garage.
Pending
$250,000
206 W Michael St, Fremont, IN 46737
3beds
1,375sqft
SingleFamily
Built in 2026
8,712 Square Feet Lot
$-- Zestimate®
$182/sqft
$-- HOA
What's special
Central airOpen conceptWater softener
- 47 days
- 256
- 2
Listed by:
Property Owner (260) 316-6907
Facts & features
Interior
Bedrooms & bathrooms
- Bedrooms: 3
- Bathrooms: 2
- Full bathrooms: 2
Heating
- Other, Gas
Features
- Basement: None
Interior area
- Total interior livable area: 1,375 sqft
Property
Parking
- Parking features: Garage - Detached
Lot
- Size: 8,712 Square Feet
Details
- Parcel number: 760221330112000004
Construction
Type & style
- Home type: SingleFamily
Materials
- Wood
- Roof: Asphalt
Condition
- New construction: No
- Year built: 2026
Community & HOA
Location
- Region: Fremont
Financial & listing details
- Price per square foot: $182/sqft
- Tax assessed value: $30,600
- Annual tax amount: $380
- Date on market: 9/13/2026
Estimated market value
Not available
Estimated sales range
Not available
$1,927/mo
Price history
| Date | Event | Price |
|---|---|---|
| 10/12/2026 | Pending sale | $250,000$182/sqft |
Source: Owner Report a problem | ||
| 9/13/2026 | Listed for sale | $250,000$182/sqft |
Source: Owner Report a problem | ||
Public tax history
| Year | Property taxes | Tax assessment |
|---|---|---|
| 2025 | $380 -0.6% | $30,600 +14.2% |
| 2024 | $382 -25.2% | $26,800 +3.9% |
| 2023 | $511 +0.7% | $25,800 -21.8% |
| 2022 | $508 +69.3% | $33,000 +3.1% |
| 2021 | $300 +15.8% | $32,000 +73% |
| 2020 | $259 -27% | $18,500 +15.6% |
| 2019 | $355 +1.3% | $16,000 -23.4% |
| 2018 | $350 +1.4% | $20,900 +1.5% |
| 2017 | $345 +3.7% | $20,600 +1.5% |
| 2016 | $333 +28.3% | $20,300 +9.7% |
| 2014 | $259 -4.9% | $18,500 -1.1% |
| 2013 | $272 +1.4% | $18,700 |
| 2012 | $269 +6.7% | $18,700 +3.3% |
| 2011 | $252 -27.6% | $18,100 -32.5% |
| 2010 | $348 +5.7% | $26,800 +0.8% |
| 2009 | $329 -2% | $26,600 +3.1% |
| 2007 | $336 +0.1% | $25,800 -0.8% |
| 2006 | $335 | $26,000 +76.6% |
| 2005 | -- | $14,720 |
Find assessor info on the county website
Monthly payment
Est. payment
Payment breakdown
Explore the cost of this home by adjusting the details. Changes won't be saved.Climate risks
Neighborhood: 46737

Similar homes
- $184,9003 bd2 ba1.3k sqft707 W Spring St, Fremont, IN 46737For Sale
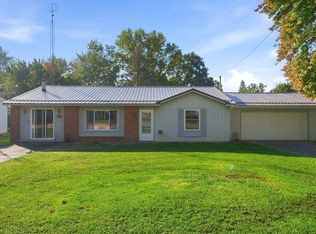 MLS ID #202644838, Teri Davis-Foster, Mike Thomas Associates, Inc.. IRMLS
- $229,5003 bd2 ba1.2k sqft602 S Broad St, Fremont, IN 46737For Sale
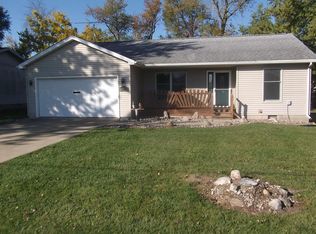 MLS ID #202643822, Craig A Rice, Booth Rose Krebs, Inc. IRMLS
- $270,0002 bd2 ba1.4k sqft822 Fairhaven Ct, Angola, IN 46703For Sale
 MLS ID #12043981, Don Oberlin, Oberlin Real Estate & Auctioneers Inc.. My State MLS
- $286,0003 bd2 ba1.7k sqft175 Lane 650a Snow Lake, Fremont, IN 46737For Sale
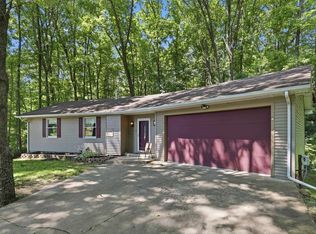 MLS ID #202617781, Donald Cary, RE/MAX Results. IRMLS
- $215,0003 bd1 ba1.4k sqft270 N Behnke Rd, Coldwater, MI 49036For Sale
 MLS ID #26057582, Mike Himes, RE/MAX Elite Group. MichRIC
- $254,9003 bd2 ba1.6k sqft271 N Fiske Rd, Coldwater, MI 49036For SaleMLS ID #26054689, Presley Guthrie, EXP Realty. MichRIC
