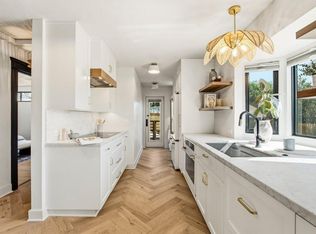
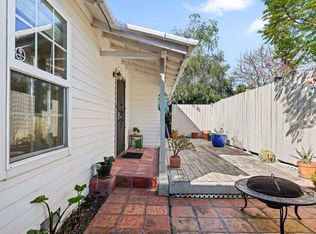
208 S. Voluntario is a quintessential California cottage offering a prime investment opportunity on Santa Barbara's desirable Eastside, just moments from the beach, Downtown, and the vibrant Funk Zone.The property features three units with an ideal unit mix of (1) 2BD/1BA, (1) 1BD/1BA, and (1) studio, well suited for both investors and owner-users. Completely remodeled throughout, the units offer hardwood floors, custom built-ins, skylights, and all new appliances and fixtures. Each unit also includes its own private outdoor space.The exterior has been freshly repainted and enhanced with new landscaping, creating strong curb appeal and a turnkey presentation. *Current property zoning is for a single family residence. Buyer to complete their own due diligence regarding permitting and Santa Barbara's rent control ordinance.
For sale
Price cut: $100K (11/9)
$1,345,000
208 S Voluntario St, Santa Barbara, CA 93103
3beds
1,760sqft
Multi Family
Built in 1950
-- sqft lot
$1,366,000 Zestimate®
$764/sqft
$-- HOA
What's special
Completely remodeled throughoutStrong curb appealCustom built-insHardwood floorsNew landscaping
- 14 days
- 801
- 37
Likely to sell faster than
Zillow last checked:
Listing updated:
Listed by:
Steve Golis DRE#: 00772218 805-965-5500,
Radius Commercial RE
Source: North Santa Barbara County MLS,MLS#: 26002167
Facts & features
Interior
Bedrooms & bathrooms
- Bedrooms: 3
- Bathrooms: 3
- Full bathrooms: 3
Heating
- Other
Cooling
- None
Appliances
- Laundry: In Unit
Interior area
- Total structure area: 1,760
- Total interior livable area: 1,760 sqft
Property
Features
- Stories: 1
Lot
- Size: 3,920 Square Feet
Details
- Parcel number: 017252008
- Zoning description: Single Family
- Special conditions: Standard
Construction
Type & style
- Home type: MultiFamily
- Property subtype: Multi Family
Materials
- Foundation: Raised
- Roof: Composition
Condition
- Year built: 1950
Community & HOA
Location
- Region: Santa Barbara
Financial & listing details
- Price per square foot: $764/sqft
- Tax assessed value: $965,698
- Date on market: 10/27/2026
- Cumulative days on market: 15 days
- Listing terms: New Loan,1031 Exchange,Cash
- Total actual rent: 104400
Estimated market value
$1,366,000
$1.30M - $1.43M
$6,058/mo
Price history
| Date | Event | Price |
|---|---|---|
| 11/9/2026 | Price change | $1,345,000-6.9%$764/sqft |
Source:  North Santa Barbara County MLS #26002167 Report a problem | ||
| 10/26/2026 | Listed for sale | $1,445,000$821/sqft |
Source:  SBMLS #26-3593 Report a problem | ||
| 10/19/2026 | Listing removed | $1,445,000$821/sqft |
Source: SBMLS #26-1586 Report a problem | ||
| 10/12/2026 | Price change | $1,445,000-3.3%$821/sqft |
Source: SBMLS #26-1586 Report a problem | ||
| 8/5/2026 | Price change | $1,495,000-3.5%$849/sqft |
Source: SBMLS #26-1586 Report a problem | ||
| 5/14/2026 | Listed for sale | $1,550,000+3.7%$881/sqft |
Source: SBMLS #26-1586 Report a problem | ||
| 5/9/2024 | Listing removed | -- |
Source: SBMLS #24-317 Report a problem | ||
| 4/22/2024 | Pending sale | $1,495,000$849/sqft |
Source: SBMLS #24-317 Report a problem | ||
| 2/23/2024 | Price change | $1,495,000-6.3%$849/sqft |
Source: SBMLS #24-317 Report a problem | ||
| 1/30/2024 | Listed for sale | $1,595,000-3.3%$906/sqft |
Source: SBMLS #24-317 Report a problem | ||
| 12/17/2023 | Listing removed | -- |
Source: SBMLS #23-1785 Report a problem | ||
| 11/4/2023 | Price change | $1,649,000-2.9%$937/sqft |
Source: SBMLS #23-1785 Report a problem | ||
| 7/30/2023 | Price change | $1,699,000-2.6%$965/sqft |
Source: SBMLS #23-1785 Report a problem | ||
| 6/20/2023 | Listed for sale | $1,745,000+91.8%$991/sqft |
Source: SBMLS #23-1785 Report a problem | ||
| 11/15/2022 | Sold | $910,000-8.9%$517/sqft |
Source: SBMLS #22-3279 Report a problem | ||
| 11/3/2022 | Pending sale | $999,000$568/sqft |
Source: SBMLS #22-3279 Report a problem | ||
| 11/3/2022 | Listed for sale | $999,000$568/sqft |
Source: SBMLS #22-3279 Report a problem | ||
| 10/11/2022 | Pending sale | $999,000$568/sqft |
Source: SBMLS #22-3279 Report a problem | ||
| 9/29/2022 | Listed for sale | $999,000$568/sqft |
Source: SBMLS #22-3279 Report a problem | ||
Public tax history
| Year | Property taxes | Tax assessment |
|---|---|---|
| 2026 | -- | $965,698 +2% |
| 2025 | $10,027 +1.7% | $946,764 +2% |
| 2024 | $9,855 +1.9% | $928,200 +2% |
| 2023 | $9,676 +5.6% | $910,000 +5.2% |
| 2022 | $9,162 +1015.3% | $865,000 +969% |
| 2021 | $821 +1.2% | $80,919 +1% |
| 2020 | $812 +2% | $80,090 +2% |
| 2019 | $796 +1.7% | $78,521 +2% |
| 2018 | $783 +3.6% | $76,982 +2% |
| 2017 | $756 -8.4% | $75,474 +2% |
| 2016 | $825 +2.8% | $73,995 +1.5% |
| 2015 | $803 | $72,885 +2% |
| 2014 | $803 | $71,458 +2.5% |
| 2012 | -- | $69,742 +2% |
| 2011 | -- | $68,375 +0.8% |
| 2010 | -- | $67,865 -0.2% |
| 2009 | -- | $68,027 +2% |
| 2008 | -- | $66,694 +2% |
| 2007 | -- | $65,388 +2% |
| 2006 | -- | $64,106 +2% |
| 2005 | -- | $62,850 +3.9% |
| 2003 | -- | $60,490 +2% |
| 2002 | -- | $59,305 +2% |
| 2001 | -- | $58,143 +2% |
| 2000 | -- | $57,004 |
Find assessor info on the county website
Monthly payment
Est. payment
Payment breakdown
Explore the cost of this home by adjusting the details. Changes won't be saved.Climate risks
Neighborhood: Eastside
- $---- bd1 ba-- sqft208 S Voluntario St #C, Santa Barbara, CA 93103Off Market

- $--2 bd1 ba-- sqft208 S Voluntario St #A, Santa Barbara, CA 93103Off Market
- $--1 bd1 ba440 sqft208 S Voluntario St #B, Santa Barbara, CA 93103Off Market

- $1,017,4002 bd1 ba816 sqft1034 Cacique St, Santa Barbara, CA 93103Off Market
Similar homes
- $1,395,0003 bd3 ba1.1k sqft34 N Milpas St, Santa Barbara, CA 93103For Sale
 MLS ID #26-3506, Ed Fuller. SBMLS
- $1,295,0003 bd3 ba1.6k sqft569 E Montecito St, Santa Barbara, CA 93103For Sale
 MLS ID #26-3090, Jorden Angel. SBMLS
- $1,649,0003 bd2 ba1.4k sqft1014 E Ortega St, Santa Barbara, CA 93103For Sale
 MLS ID #26-3709, Austin Jones. SBMLS
- $1,395,0003 bd3 ba1.9k sqft2335 Cliff Dr, Santa Barbara, CA 93109For Sale
 MLS ID #26-3522, David C Allen. SBMLS
