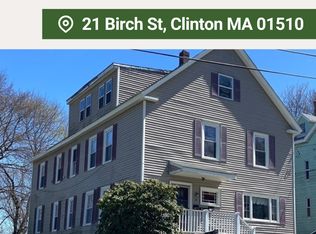
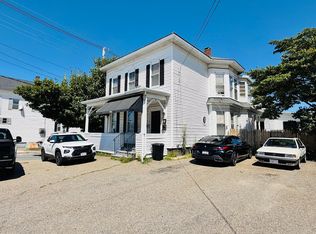
Prime multi-family investment opportunity at 21 Birch St in Clinton, MA, currently generating an impressive gross income of $8,600 per month! This turnkey property delivers strong cash flow, making it an exceptional addition to any investor's portfolio or an ideal owner-occupied investment. Conveniently located close to local shops, dining, major routes, and the scenic Wachusett Reservoir, tenants will love the accessibility and neighborhood appeal. Don't miss out on this high-yielding income producer in a desirable Central MA location!
For sale
Price cut: $100K (11/16)
$849,900
21 Birch St, Clinton, MA 01510
6beds
3,300sqft
3 Family
Built in 1910
-- sqft lot
$820,500 Zestimate®
$258/sqft
$-- HOA
What's special
- 20 days
- 290
- 11
Zillow last checked:
Listing updated:
Listed by:
Hejoma M. Garcia 774-242-8832,
RE/MAX Diverse 774-823-3441
Source: MLS PIN,MLS#: 73595204
Facts & features
Interior
Bedrooms & bathrooms
- Bedrooms: 6
- Bathrooms: 4
- Full bathrooms: 4
Heating
- Natural Gas
Features
- Living Room, Dining Room, Kitchen, Living RM/Dining RM Combo
- Flooring: Wood, Plywood, Hardwood
- Basement: Finished
- Has fireplace: No
Interior area
- Total structure area: 3,300
- Total interior livable area: 3,300 sqft
- Finished area above ground: 3,300
Video & virtual tour
Property
Parking
- Total spaces: 5
- Parking features: Off Street
- Uncovered spaces: 5
Features
- Patio & porch: Porch, Deck - Wood
Lot
- Size: 0.29 Acres
- Features: Zero Lot Line
Details
- Parcel number: M:0076 B:0440 L:0000,3307772
- Zoning: R1
Construction
Type & style
- Home type: MultiFamily
- Property subtype: 3 Family
Materials
- Foundation: Other
Condition
- Year built: 1910
Utilities & green energy
- Electric: 110 Volts, Individually Metered
- Sewer: Public Sewer
- Water: Public
- Utilities for property: for Gas Range, for Electric Range
Community & HOA
Location
- Region: Clinton
Financial & listing details
- Price per square foot: $258/sqft
- Tax assessed value: $654,200
- Annual tax amount: $8,492
- Date on market: 10/27/2026
- Listing terms: Contract
- Exclusions: Tenant Personal Property
- Total actual rent: 8600
Estimated market value
$820,500
$779,000 - $862,000
$2,497/mo
Price history
| Date | Event | Price |
|---|---|---|
| 11/16/2026 | Price change | $849,900-10.5%$258/sqft |
Source: MLS PIN #73595204 Report a problem | ||
| 10/26/2026 | Listed for sale | $949,900+65.2%$288/sqft |
Source: MLS PIN #73595204 Report a problem | ||
| 6/24/2024 | Sold | $575,000+4.7%$174/sqft |
Source: MLS PIN #73230756 Report a problem | ||
| 5/13/2024 | Listed for sale | $549,000+2645%$166/sqft |
Source: MLS PIN #73230756 Report a problem | ||
| 8/25/1989 | Sold | $20,000$6/sqft |
Source: Public Record Report a problem | ||
Public tax history
| Year | Property taxes | Tax assessment |
|---|---|---|
| 2025 | $7,183 +16.4% | $540,100 +15% |
| 2024 | $6,172 +3.4% | $469,700 +5.2% |
| 2023 | $5,968 -2.5% | $446,400 +8.8% |
| 2022 | $6,118 +27% | $410,300 +35.7% |
| 2021 | $4,819 +9.1% | $302,300 +6% |
| 2020 | $4,418 +7.4% | $285,200 +10.4% |
| 2019 | $4,115 +1.5% | $258,300 +8.2% |
| 2018 | $4,055 -6.6% | $238,800 -2.8% |
| 2017 | $4,343 +2.3% | $245,800 |
| 2016 | $4,245 +7.1% | $245,800 +3.3% |
| 2015 | $3,963 +3.1% | $237,900 |
| 2014 | $3,842 +3.6% | $237,900 |
| 2013 | $3,709 +2% | $237,900 |
| 2012 | $3,635 -9.9% | $237,900 -16.7% |
| 2011 | $4,036 +5.8% | $285,600 |
| 2010 | $3,813 +8% | $285,600 -2% |
| 2009 | $3,529 -3.3% | $291,400 -9.4% |
| 2008 | $3,648 +3.4% | $321,700 |
| 2007 | $3,529 +3.2% | $321,700 |
| 2006 | $3,420 +5.1% | $321,700 +15.4% |
| 2005 | $3,254 +28.8% | $278,800 +49.3% |
| 2004 | $2,526 +0.7% | $186,800 |
| 2003 | $2,509 +1.8% | $186,800 +22.8% |
| 2002 | $2,464 +6.1% | $152,100 +5.6% |
| 2000 | $2,323 | $144,100 |
Find assessor info on the county website
Monthly payment
Est. payment
Payment breakdown
Explore the cost of this home by adjusting the details. Changes won't be saved.Climate risks
Neighborhood: 01510
Similar homes
- $850,0009 bd4 ba4k sqft147 1/2 Oak St, Clinton, MA 01510For Sale
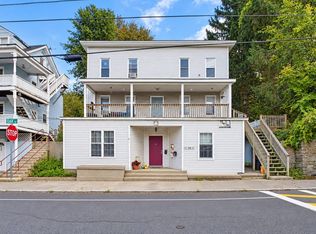 MLS ID #73582002, Trish Marchetti, Berkshire Hathaway HomeServices Commonwealth Real Estate. MLS PIN
- $1,099,0007 bd4 ba4.6k sqft248-250 Chestnut St, Clinton, MA 01510For Sale
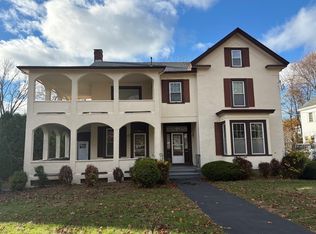 MLS ID #73602047, Ellie Cacollari, Real Broker MA, LLC. MLS PIN
- $749,0004 bd4 ba3.7k sqft719 Main St, Clinton, MA 01510For Sale
 MLS ID #73566262, Rodrigo Azevedo, Pablo Maia Realty. MLS PIN
- $925,0008 bd3 ba3.3k sqft122 Lawrence St, Clinton, MA 01510For Sale
 MLS ID #73568062, Nicole Glover, Coldwell Banker Realty - Leominster. MLS PIN
