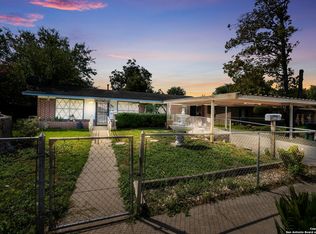
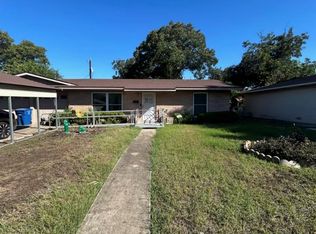
This 1200 square foot single family home has 3 bedrooms and 1.0 bathrooms. This home is located at 211 Robeson Ave, San Antonio, TX 78220.
Pre-foreclosure
Street View
Est. $159,390
211 Robeson Ave, San Antonio, TX 78220
3beds
1baths
1,200sqft
SingleFamily
Built in 1953
7,305 Square Feet Lot
$-- Zestimate®
$133/sqft
$-- HOA
Overview
- 37 days
- 38
- 0
Facts & features
Interior
Bedrooms & bathrooms
- Bedrooms: 3
- Bathrooms: 1
Heating
- Wall
Cooling
- None
Interior area
- Total interior livable area: 1,200 sqft
Property
Parking
- Parking features: Carport, Garage - Detached
Features
- Exterior features: Other
Lot
- Size: 7,305 Square Feet
Details
- Parcel number: 441480
Construction
Type & style
- Home type: SingleFamily
Materials
- Foundation: Piers
- Roof: Asphalt
Condition
- Year built: 1953
Community & HOA
Location
- Region: San Antonio
Financial & listing details
- Price per square foot: $133/sqft
- Tax assessed value: $159,390
Foreclosure details
Estimated market value
Not available
Estimated sales range
Not available
$1,244/mo
Price history
| Date | Event | Price |
|---|---|---|
| 9/15/2026 | Listing removed | $90,000$75/sqft |
Source:  LERA MLS #1969379 Report a problem | ||
| 8/7/2026 | Price change | $90,000-5.3%$75/sqft |
Source: LERA MLS #1969379 Report a problem | ||
| 7/27/2026 | Price change | $95,000-5%$79/sqft |
Source: LERA MLS #1969379 Report a problem | ||
| 6/28/2026 | Price change | $100,000-9.1%$83/sqft |
Source: LERA MLS #1969379 Report a problem | ||
| 6/7/2026 | Price change | $110,000-12%$92/sqft |
Source: LERA MLS #1969379 Report a problem | ||
| 5/22/2026 | Listed for sale | $125,000+66.7%$104/sqft |
Source: LERA MLS #1969379 Report a problem | ||
| 11/16/2022 | Sold | -- |
Source: Agent Provided Report a problem | ||
| 11/7/2022 | Pending sale | $75,000$63/sqft |
Source: LERA MLS #1648784 Report a problem | ||
| 11/2/2022 | Listed for sale | $75,000$63/sqft |
Source: LERA MLS #1648784 Report a problem | ||
Public tax history
| Year | Property taxes | Tax assessment |
|---|---|---|
| 2026 | -- | $159,390 -6.8% |
| 2025 | $4,174 -0.9% | $171,020 -0.9% |
| 2024 | $4,212 +26% | $172,630 +28.7% |
| 2023 | $3,344 -11% | $134,160 -3.3% |
| 2022 | $3,758 +53.3% | $138,690 +35.6% |
| 2021 | $2,451 | $102,310 +6.3% |
| 2020 | $2,451 +2.7% | $96,290 +14.3% |
| 2019 | $2,387 | $84,230 +17.7% |
| 2018 | $2,387 +57.9% | $71,570 +34.4% |
| 2017 | $1,512 +11.9% | $53,270 +11.3% |
| 2016 | $1,351 -2.5% | $47,860 +3.2% |
| 2015 | $1,386 | $46,380 -9.5% |
| 2014 | $1,386 | $51,230 +41.8% |
| 2013 | -- | $36,120 -7% |
| 2012 | -- | $38,840 -10.8% |
| 2011 | -- | $43,520 -7.4% |
| 2010 | -- | $47,000 -11.4% |
| 2009 | -- | $53,060 +5.4% |
| 2008 | -- | $50,336 -0.6% |
| 2007 | -- | $50,650 +21.8% |
| 2006 | -- | $41,600 +1.7% |
| 2005 | -- | $40,900 |
| 2004 | -- | -- |
| 2003 | -- | -- |
| 2002 | -- | -- |
| 2001 | -- | -- |
| 2000 | -- | -- |
Find assessor info on the county website
Monthly payment
Climate risks
Neighborhood: 78220
Similar homes
- $169,0003 bd2 ba1.6k sqft5030 Creekmoor, San Antonio, TX 78220For Sale
 MLS ID #1913307, Andrew Ugarte TREC #588707, Andrew G Ugarte, REALTORS. LERA MLS
- $150,0003 bd2 ba1.5k sqft4554 Emil St., San Antonio, TX 78219For Sale
 MLS ID #2028900, Kenneth Martinez TREC #215875, Great Metro Realty. LERA MLS
- $129,0003 bd2 ba1.2k sqft4923 Stoneleigh Dr, San Antonio, TX 78220Active
 MLS ID #7012939, Kyle Ledford, Keller Williams Realty. Unlock MLS
- $135,0003 bd2 ba1.2k sqft419 Upland Rd, San Antonio, TX 78220For Sale By Owner
- $172,9993 bd2 ba1.4k sqft234 KILLARNEY DR, San Antonio, TX 78223For SaleMLS ID #2029352, Kieu Huynh TREC #757650, Real Broker, LLC. LERA MLS
- $164,9002 bd2 ba960 sqft602 Canton, San Antonio, TX 78202For SaleMLS ID #2017854, Seth Teel TREC #620984, Somos Real Estate. LERA MLS
- $154,9004 bd3 ba1.5k sqft483 W Harding Blvd, San Antonio, TX 78221For SaleMLS ID #2025441, Robert Lashley TREC #819515, Exquisite Properties, LLC. LERA MLS
- $119,0004 bd1 ba1.2k sqft1638 Rigsby Ave, San Antonio, TX 78210For SaleMLS ID #2028041, Joe Iley TREC #554437, 1st Choice Realty Group. LERA MLS
- $130,0002 bd1 ba1.1k sqft513 Lamar St, San Antonio, TX 78202For SaleMLS ID #2030211, Bryan Ryder TREC #695901, JB Goodwin, REALTORS. LERA MLS
- $130,0003 bd2 ba1.5k sqft510 AVONDALE AVE, San Antonio, TX 78223For SaleMLS ID #2020899, Jonathan Butler TREC #669150, Keller Williams City-View. LERA MLS
- $125,0003 bd2 ba864 sqft215 Gulf, San Antonio, TX 78202For SaleMLS ID #2029297, David Amador TREC #743778, Encore Fine Properties. LERA MLS
- $135,0003 bd2 ba912 sqft636 HOT WELLS BLVD, San Antonio, TX 78223For SaleMLS ID #2021218, Flor Enciso TREC #843507, Realty One Group Emerald. LERA MLS
- $159,9992 bd2 ba1.1k sqft607 Rockwell Blvd, San Antonio, TX 78224For SaleMLS ID #1997890, Ana Chavez TREC #795648, Resi Realty, LLC. LERA MLS
- $149,9003 bd2 ba1.2k sqft221 S SAN MANUEL ST, San Antonio, TX 78237For SaleMLS ID #2021249, Jose Puente TREC #709365, Option One Real Estate. LERA MLS
- $165,0003 bd1 ba957 sqft257 BANK ST, San Antonio, TX 78204For SaleMLS ID #1964301, Jeffrey Pozzi TREC #624760, Coldwell Banker D'Ann Harper. LERA MLS
- $159,9003 bd2 ba1.4k sqft155 Rosebud, San Antonio, TX 78221New ConstructionMLS ID #1968702, Zagla Saenz TREC #667407, White Line Realty LLC. LERA MLS
- $119,9003 bd1 ba1.1k sqft146 Mary Helen Dr, San Antonio, TX 78222For SaleMLS ID #2011198, Craig Morris TREC #763688, Morris Realty. LERA MLS
- $125,0003 bd1 ba1k sqft231 Sandra, San Antonio, TX 78223For SaleMLS ID #2019625, Amelia Gallo TREC #648402, Kerr Realty. LERA MLS
- $134,9003 bd1 ba920 sqft122 PERSYN ST, San Antonio, TX 78207For SaleMLS ID #2030186, Hillary Romero TREC #683848, Home Sweet San Antonio LLC. LERA MLS
- $168,0003 bd1 ba1.6k sqft411 E Ansley, San Antonio, TX 78221For SaleMLS ID #1933009, Debbie Luna TREC #651083, Connect Realty.com. LERA MLS
