Welcome to 2113 Cedarbrook Dr, an exciting opportunity to own a refreshed four-bedroom, two-bathroom home in Fairfield! With new carpet, fresh interior paint, and thoughtful updates throughout, this inviting residence is ready for its next chapter. Inside, the spacious layout provides flexibility for everyday living, relaxing, entertaining, or creating dedicated work and hobby spaces. Step outside to a low-maintenance backyard designed for easy enjoyment, whether you're hosting a barbecue, savoring a quiet morning coffee or want to create your own outdoor retreat. Nearby Rolling Hills Neighborhood Park offers green space, a playground, picnic area, and basketball court. Dunnell Nature Park & Education Center provides even more options for trails, open space, sports, and outdoor recreation. Ideally located near shopping, dining, schools, parks, and everyday conveniences. Don't miss the chance to make this move-in-ready home your own!
Active
$575,000
2113 Cedarbrook Dr, Fairfield, CA 94534
4beds
1,512sqft
Single Family Residence
Built in 1980
3,484 Square Feet Lot
$544,100 Zestimate®
$380/sqft
$-- HOA
What's special
Low-maintenance backyardRefreshed four-bedroom two-bathroom homeSpacious layoutFresh interior paintThoughtful updates throughoutNew carpet
- 9 hours
- 65
- 3
Zillow last checked:
Listing updated:
Listed by:
Sean Smith DRE #02023748 661-400-7373,
Select Realty Team
Source: MetroList Services of CA,MLS#: 326088498Originating MLS: MetroList Services, Inc.
Facts & features
Interior
Bedrooms & bathrooms
- Bedrooms: 4
- Bathrooms: 3
- Full bathrooms: 2
- Partial bathrooms: 1
Heating
- Central
Cooling
- Central Air
Appliances
- Laundry: In Garage
Features
- Number of fireplaces: 1
- Fireplace features: Living Room
Interior area
- Total interior livable area: 1,512 sqft
Property
Parking
- Total spaces: 4
- Parking features: Detached
- Garage spaces: 2
- Uncovered spaces: 2
Features
- Levels: Two
- Stories: 2
Lot
- Size: 3,484 Square Feet
- Features: Shape Regular
Details
- Parcel number: 0156151420
- Special conditions: Standard
Construction
Type & style
- Home type: SingleFamily
- Property subtype: Single Family Residence
Condition
- Year built: 1980
Utilities & green energy
- Sewer: Public Sewer
- Water: Public
- Utilities for property: Electric
Community & HOA
Location
- Region: Fairfield
Financial & listing details
- Price per square foot: $380/sqft
- Tax assessed value: $584,512
- Price range: $575K - $575K
- Date on market: 10/22/2026
Estimated market value
$544,100
$517,000 - $571,000
$3,049/mo
Price history
| Date | Event | Price |
|---|---|---|
| 10/22/2026 | Listed for sale | $575,000+6.5%$380/sqft |
Source: MetroList Services of CA #326088498 Report a problem | ||
| 9/12/2024 | Listing removed | $2,600$2/sqft |
Source: Zillow Rentals Report a problem | ||
| 8/3/2024 | Price change | $2,600-7.1%$2/sqft |
Source: Zillow Rentals Report a problem | ||
| 7/23/2024 | Price change | $2,800-6.5%$2/sqft |
Source: Zillow Rentals Report a problem | ||
| 6/7/2024 | Listed for rent | $2,995$2/sqft |
Source: Zillow Rentals Report a problem | ||
| 6/30/2022 | Sold | $540,000-0.9%$357/sqft |
Source: Public Record Report a problem | ||
| 5/10/2022 | Pending sale | $545,000$360/sqft |
Source:  BAREIS #322038120 Report a problem | ||
| 4/29/2022 | Listed for sale | $545,000+43.4%$360/sqft |
Source: BAREIS #322038120 Report a problem | ||
| 12/3/2004 | Sold | $380,000$251/sqft |
Source: Public Record Report a problem | ||
Public tax history
| Year | Property taxes | Tax assessment |
|---|---|---|
| 2026 | -- | $584,512 +2% |
| 2025 | $6,393 0% | $573,052 +2% |
| 2024 | $6,395 +11.6% | $561,816 +10.4% |
| 2023 | $5,731 +2.7% | $509,112 +2% |
| 2022 | $5,583 +14.3% | $499,131 +15.3% |
| 2021 | $4,884 +1.6% | $433,000 +0.2% |
| 2020 | $4,808 +3.2% | $432,000 +2.6% |
| 2019 | $4,659 -4.3% | $421,000 +0.7% |
| 2018 | $4,870 +22.3% | $418,000 +18.8% |
| 2017 | $3,982 +15.4% | $352,000 +16.6% |
| 2016 | $3,449 +10.7% | $302,000 +4.9% |
| 2015 | $3,115 +13.9% | $288,000 +14.7% |
| 2014 | $2,736 | $251,000 +32.8% |
| 2013 | -- | $189,000 +2.7% |
| 2012 | -- | $184,000 +4% |
| 2011 | -- | $177,000 -1.1% |
| 2010 | -- | $179,000 -16.4% |
| 2009 | -- | $214,000 -37.4% |
| 2008 | -- | $342,000 -13.5% |
| 2007 | -- | $395,352 +2% |
| 2006 | -- | $387,600 +2% |
| 2005 | -- | $380,000 +191.6% |
| 2004 | -- | $130,320 +1.9% |
| 2003 | -- | $127,932 +2% |
| 2002 | -- | $125,424 +2% |
| 2001 | -- | $122,964 +2% |
| 2000 | $1,264 | $120,552 |
Find assessor info on the county website
Monthly payment
Est. payment
Payment breakdown
Explore the cost of this home by adjusting the details. Changes won't be saved.Climate risks
Neighborhood: 94534
Similar homes
- $550,0004 bd3 ba1.5k sqft2705 Owens Street, Fairfield, CA 94534For Sale
 MLS ID #326088049, Candice Sullivan, Country Estates Inc. BAREIS
- $465,0003 bd1 ba1k sqft2842 Montclair Way, Fairfield, CA 94534For Sale
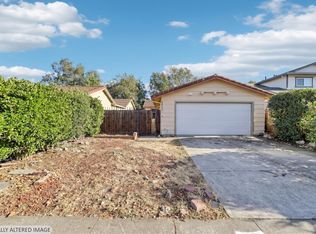 MLS ID #326084759, Manny Cabrera, Redfin. BAREIS
- $724,9994 bd3 ba2k sqft3549 Larchmont Ct, Fairfield, CA 94534For Sale
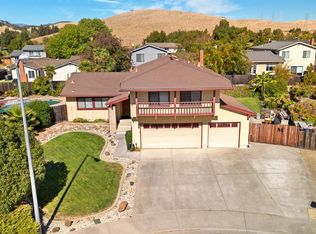 MLS ID #326088539, Jaidin Avenn Love. MetroList Services of CA
- $600,0004 bd2 ba1.7k sqft2962 Carmel Way, Fairfield, CA 94534For Sale
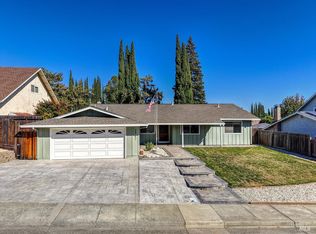 MLS ID #326068851, Janine Borghello. MetroList Services of CA
