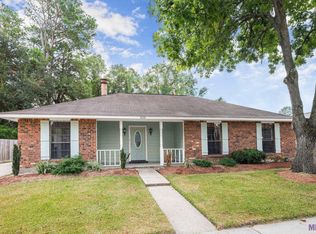
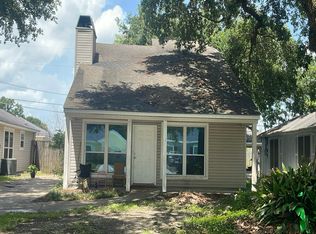
This is a 1428 square foot, single family home. This home is located at 2124 General Taylor Ave, Baton Rouge, LA 70810.
Foreclosed
Street View
Est. $147,100
2124 General Taylor Ave, Baton Rouge, LA 70810
--beds
--baths
1,428sqft
SingleFamily
Built in 1979
1 Acres Lot
$147,100 Zestimate®
$103/sqft
$-- HOA
Overview
- 48 days |
- 6 |
- 0 |
Facts & features
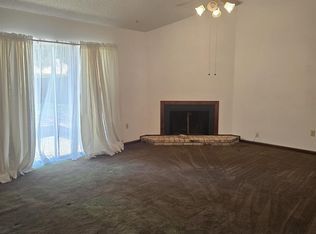
Interior
Interior area
- Total interior livable area: 1,428 sqft
Property
Parking
- Parking features: Garage - Attached
Lot
- Size: 1 Acres
Details
- Parcel number: 03092542
Construction
Type & style
- Home type: SingleFamily
Condition
- Year built: 1979
Community & HOA
Location
- Region: Baton Rouge
Financial & listing details
- Price per square foot: $103/sqft
- Tax assessed value: $164,220
- Annual tax amount: $1,181
Visit our professional directory to find a foreclosure specialist in your area that can help with your home search.
Find a foreclosure agentForeclosure details
Estimated market value
$147,100
$125,000 - $174,000
$1,754/mo
Price history
| Date | Event | Price |
|---|---|---|
| 5/12/2026 | Sold | -- |
Source: Public Record Report a problem | ||
| 12/7/1999 | Sold | -- |
Source: Public Record Report a problem | ||
Public tax history
| Year | Property taxes | Tax assessment |
|---|---|---|
| 2025 | $1,181 -0.4% | $16,422 |
| 2024 | $1,186 +38.4% | $16,422 +21% |
| 2023 | $857 +2.7% | $13,570 |
| 2022 | $834 +1.6% | $13,570 |
| 2021 | $821 +0.8% | $13,570 |
| 2020 | $814 -37.5% | $13,570 +35.7% |
| 2019 | $1,303 +1.2% | $10,000 |
| 2018 | $1,288 +206% | $10,000 |
| 2017 | $421 | $10,000 +42.3% |
| 2016 | $421 +219% | $7,025 -29.8% |
| 2015 | $132 -67.6% | $10,000 |
| 2014 | $407 | $10,000 |
| 2013 | $407 -67% | $10,000 |
| 2012 | $1,232 +11.7% | $10,000 +14.3% |
| 2011 | $1,103 +1% | $8,750 |
| 2010 | $1,092 +691.7% | $8,750 |
| 2008 | $138 +315.4% | $8,750 +12.2% |
| 2007 | $33 -1.6% | $7,800 |
| 2006 | $34 -1.7% | $7,800 |
| 2005 | $34 +3.6% | $7,800 |
| 2004 | $33 -49.6% | $7,800 |
| 2003 | $66 +0% | $7,800 |
| 2002 | $66 +1.5% | $7,800 |
| 2001 | $65 +97.8% | $7,800 |
| 2000 | $33 | $7,800 |
Find assessor info on the county website
Monthly payment
Estimated monthly payment$1,822
All calculations are estimates and provided by Zillow, Inc. for informational purposes only. Actual amounts may vary.
HOA fees may include property taxes on listings classified as Co-Ops. Contact the listing agent and/or owner for fee details.
Mortgage interest rates are dependent on a number of factors, including credit score, down payment, and repayment length. Interest rate data provided by Zillow Group Marketplace, Inc. as of 1/1/1970 from various mortgage lenders with which we have lead or other similar arrangements; the Estimated Payment is an average of those rates.
See how much you could borrow to make a competitive offer.
Climate risks
Neighborhood: South Burbank
Nearby schools
GreatSchools rating
- 7/10Magnolia Woods Elementary SchoolGrades: PK-5Distance: 2.2 mi
- 4/10Westdale Middle SchoolGrades: 6-8Distance: 6.2 mi
- 2/10Tara High SchoolGrades: 9-12Distance: 6.2 mi


- Louisiana
- East Baton Rouge Parish
- Baton Rouge
- 70810
- South Burbank
- 2124 General Taylor Ave
Nearby cities
Nearby neighborhoods
Nearby zip codes
Other Baton Rouge Topics
