SOLD BEFORE PROCESSING, ALL CASH , NO CONTINGENCIES
Pending
Listed by: Value One Real Estate • Steven Goldbaum • 818-515-2006
$500,000
2137 N Swindon Ave, Simi Valley, CA 93063
3beds
1,217sqft
Single Family Residence
Built in 1973
6,502 Square Feet Lot
$517,900 Zestimate®
$411/sqft
$-- HOA
What's special
- 4 days
- 17
- 2
Zillow last checked:
Listing updated:
Listed by:
Steven Goldbaum DRE #01256906 818-515-2006,
Value One Real Estate
Source: CRMLS,MLS#: SR26214589 Originating MLS: California Regional MLS
Facts & features
Interior
Bedrooms & bathrooms
- Bedrooms: 3
- Bathrooms: 2
- Full bathrooms: 2
- Main level bathrooms: 2
- Main level bedrooms: 33
Rooms
- Room types: Bedroom
Bedroom
- Features: All Bedrooms Down
Cooling
- None
Appliances
- Laundry: In Garage
Features
- All Bedrooms Down
- Has fireplace: Yes
- Fireplace features: Family Room
- Common walls with other units/homes: No Common Walls
Interior area
- Total interior livable area: 1,217 sqft
Property
Parking
- Total spaces: 2
- Parking features: Garage - Attached
- Attached garage spaces: 2
Features
- Levels: One
- Stories: 1
- Entry location: front
- Pool features: None
Lot
- Size: 6,502 Square Feet
- Features: 0-1 Unit/Acre
Details
- Parcel number: 6570063205
- Special conditions: Standard
Construction
Type & style
- Home type: SingleFamily
- Property subtype: Single Family Residence
Condition
- New construction: No
- Year built: 1973
Utilities & green energy
- Sewer: Public Sewer
- Water: Public
Community & HOA
Community
- Features: Curbs
- Subdivision: Other
Location
- Region: Simi Valley
Financial & listing details
- Price per square foot: $411/sqft
- Tax assessed value: $231,505
- Date on market: 10/1/2026
- Listing terms: Cash
Estimated market value
$517,900
$492,000 - $544,000
$3,416/mo
Price history
| Date | Event | Price |
|---|---|---|
| 10/2/2026 | Pending sale | $500,000$411/sqft |
Source:  CRMLS #SR26214589 Report a problem | ||
Public tax history
| Year | Property taxes | Tax assessment |
|---|---|---|
| 2026 | -- | $231,505 +2% |
| 2025 | $3,181 +7.8% | $226,966 +2% |
| 2024 | $2,951 | $222,516 +2% |
| 2023 | $2,951 +1.3% | $218,153 +2% |
| 2022 | $2,914 +1.6% | $213,876 +2% |
| 2021 | $2,870 +2.7% | $209,683 +1% |
| 2020 | $2,794 +4.9% | $207,535 +2% |
| 2019 | $2,663 +1.5% | $203,466 +2% |
| 2018 | $2,625 +2.8% | $199,477 +2% |
| 2017 | $2,554 +5% | $195,567 +2% |
| 2016 | $2,433 +2.7% | $191,734 +1.5% |
| 2015 | $2,370 +2.1% | $188,856 +2% |
| 2014 | $2,322 | $185,159 +0.5% |
| 2013 | -- | $184,324 +2% |
| 2012 | -- | $180,711 +2% |
| 2011 | -- | $177,168 +0.5% |
| 2009 | -- | $176,266 +4% |
| 2007 | -- | $169,424 +2% |
| 2006 | -- | $166,103 +2% |
| 2005 | -- | $162,847 +3.9% |
| 2003 | -- | $156,730 +2% |
| 2002 | -- | $153,658 +2% |
| 2001 | $1,752 +1.8% | $150,646 +2% |
| 2000 | $1,721 | $147,693 |
Find assessor info on the county website
Monthly payment
Est. payment
Payment breakdown
Explore the cost of this home by adjusting the details. Changes won't be saved.Climate risks
Neighborhood: 93063
- $869,1005 bd2 ba2.2k sqft2136 N Belhaven Ave, Simi Valley, CA 93063Off Market
- $780,3004 bd2 ba1.6k sqft2125 N Swindon Ave, Simi Valley, CA 93063Off Market

- $783,3004 bd2 ba1.5k sqft2124 N Belhaven Ave, Simi Valley, CA 93063Off Market

- $783,7003 bd2 ba1.4k sqft2148 N Belhaven Ave, Simi Valley, CA 93063Off Market
Similar homes
- $490,0003 bd2 ba1.2k sqft24431 Trevino Dr Unit V10, Valencia, CA 91355For Sale
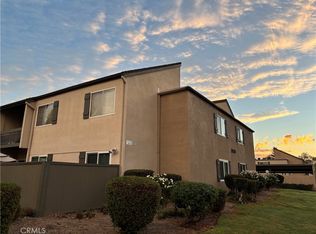 MLS ID #SR26228346, Karen Carter, Golden Oak Realty. CRMLS
- $679,9003 bd3 ba1.6k sqft2470 Stow St, Simi Valley, CA 93063For Sale
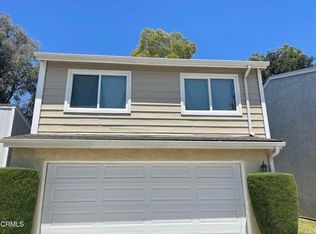 MLS ID #V1-38493, Chris Russello, Christopher Russello, Broker. CRMLS
- $339,0003 bd2 ba1.7k sqft1550 Rory Ln Space 216, Simi Valley, CA 93063For Sale
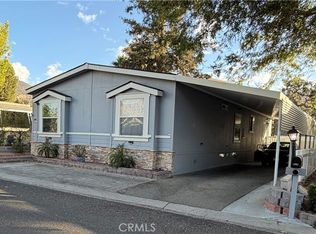 MLS ID #SR26189043, Jack Lees, TLC Realty. CRMLS
- $489,0002 bd2 ba951 sqft10220 De Soto Ave Unit 6, Chatsworth, CA 91311For Sale
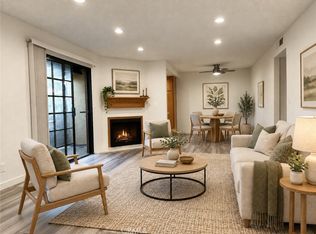 MLS ID #CV26185466, Zee Saleh, COLDWELL BANKER REALTY. CRMLS
Local buyer's agents are ready to help
