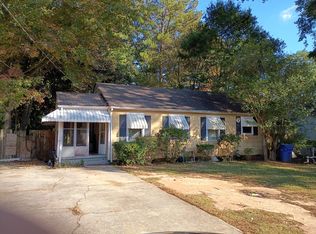
Very bad shape good bones nice flooring
For sale by owner
$55,000
2158 Burroughs Ave SE, Atlanta, GA 30315
2beds
1,100sqft
SingleFamily
Built in 1954
8,999 Square Feet Lot
$-- Zestimate®
$50/sqft
$-- HOA
What's special
Nice flooring
- 21 days
- 1,587
- 110
Listed by:
Property Owner (770) 744-8895
Facts & features
Interior
Bedrooms & bathrooms
- Bedrooms: 2
- Bathrooms: 1
- Full bathrooms: 1
Heating
- None, Forced air
Cooling
- Central
Features
- Basement: Basement (not specified)
Interior area
- Total interior livable area: 1,100 sqft
Property
Parking
- Parking features: Off-street
Features
- Exterior features: Brick
Lot
- Size: 8,999 Square Feet
Details
- Parcel number: 14003800020351
Construction
Type & style
- Home type: SingleFamily
Materials
- Stone
- Foundation: Crawl/Raised
Condition
- New construction: No
- Year built: 1954
Community & HOA
Location
- Region: Atlanta
Financial & listing details
- Price per square foot: $50/sqft
- Tax assessed value: $81,200
- Annual tax amount: $1,329
- Date on market: 10/30/2026
Estimated market value
Not available
Estimated sales range
Not available
$1,694/mo
Price history
| Date | Event | Price |
|---|---|---|
| 10/30/2026 | Listed for sale | $55,000-16%$50/sqft |
Source: Owner Report a problem | ||
| 2/11/2021 | Sold | $65,500+9.2%$60/sqft |
Source:  GAMLS #8922593 Report a problem | ||
| 2/5/2021 | Pending sale | $60,000$55/sqft |
Source:  FMLS GA #6835911 Report a problem | ||
| 2/3/2021 | Listed for sale | $60,000+3900%$55/sqft |
Source: FMLS GA #6835911 Report a problem | ||
| 1/5/2018 | Sold | $1,500-85%$1/sqft |
Source: Public Record Report a problem | ||
| 11/29/2007 | Sold | $10,000$9/sqft |
Source: Public Record Report a problem | ||
Public tax history
| Year | Property taxes | Tax assessment |
|---|---|---|
| 2025 | $1,329 +14.3% | $32,480 +14.4% |
| 2024 | $1,163 -3.1% | $28,400 -24.5% |
| 2023 | $1,199 +89% | $37,600 +139.8% |
| 2022 | $635 +36.7% | $15,680 +39.5% |
| 2021 | $464 -6.9% | $11,240 -6.6% |
| 2020 | $498 -30.5% | $12,040 +52% |
| 2019 | $717 | $7,920 +41.4% |
| 2018 | $717 | $5,600 +4.5% |
| 2017 | $717 +47.7% | $5,360 |
| 2016 | $486 -31.6% | $5,360 |
| 2015 | $710 +192.2% | $5,360 |
| 2014 | $243 +115.2% | $5,360 +109.4% |
| 2013 | $113 +63% | $2,560 +64.1% |
| 2012 | $69 -66.8% | $1,560 -62.1% |
| 2011 | $209 -52% | $4,120 -58.1% |
| 2010 | $435 -11.5% | $9,840 -10.9% |
| 2009 | $491 -72.8% | $11,040 -70.9% |
| 2008 | $1,804 +11.8% | $38,000 |
| 2007 | $1,614 | $38,000 |
Find assessor info on the county website
Monthly payment
Est. payment
Payment breakdown
Explore the cost of this home by adjusting the details. Changes won't be saved.Climate risks
Neighborhood: Lakewood Heights

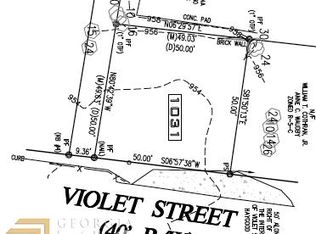
Similar homes
- $52,5003 bd1 ba1k sqft2025 Moody Dr SW, Atlanta, GA 30315Active
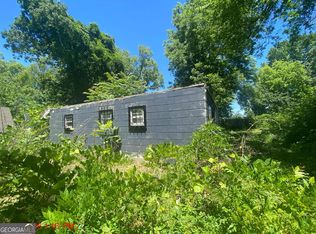
 MLS ID #10785099, Zara Williams, Keller Williams Realty Cityside. GAMLS
- $50,0003 bd2 ba1.3k sqft9 Charleston Ave SE, Atlanta, GA 30315Auction
 Xome
- $55,0002 bd1 ba1.1k sqft509 N Harding St, Albany, GA 31701Active
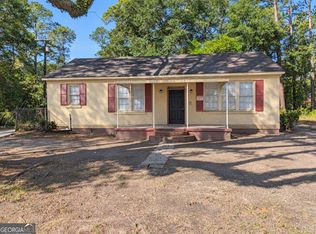 MLS ID #10878223, Tiffany Vicks, Victory Real Estate Solutions. GAMLS
- $60,0002 bd1 ba900 sqft140 Mount Zion Rd SE #44, Atlanta, GA 30354Active
 MLS ID #10888496, Marquita Cooper, Town Square Realty, Inc.. GAMLS
- $59,9003 bd2 ba1.2k sqft491 Center Hill Ave NW, Atlanta, GA 30318ActiveMLS ID #10822765, Stephen Lytle, GPS Property Management LLC. GAMLS
- $54,9002 bd2 ba1.1k sqft1660 Stanton Rd SW APT 4D, Atlanta, GA 30311For Sale
 MLS ID #7829435, Nelson Torres, EXP Realty, LLC.. FMLS GA
- $64,9003 bd1 ba1k sqft2835 Burton Rd NW, Atlanta, GA 30311ActiveMLS ID #10845932, Donna R Knowles, Keller Williams River Cities. GAMLS
- $64,9002 bd1 ba1.2k sqft3074 Delowe Dr, East Pt, GA 30344ActiveMLS ID #10881602, Joshua J Bazzetta, Christopher Scott Realty Group. GAMLS
- $45,0003 bd3 ba1.3k sqft1867 Myrtle Dr SW APT 12, Atlanta, GA 30311Active Under ContractMLS ID #10889907, James Brightwell, Keller Williams Realty Atl. Partners. GAMLS
- $59,0003 bd2 ba1.1k sqft1625 Conley Rd #220, Conley, GA 30288ActiveMLS ID #10883436, Dana Elliott, Atlanta Communities. GAMLS
- $67,9003 bd2 ba1k sqft958 Ira St SW, Atlanta, GA 30310ActiveMLS ID #10838576, Jason H Harris, Harris Real Estate Services. GAMLS
- $60,0003 bd3 ba864 sqft1660 Stanton Rd SW APT 1B, Atlanta, GA 30311ActiveMLS ID #10873412, Michael Tally, Tally Real Estate Group LLC. GAMLS
- $65,0002 bd2 ba1.2k sqft1660 Stanton Rd SW APT 5G, Atlanta, GA 30311ActiveMLS ID #10888484, Elena A Gist, Keller Williams Realty Buckhead. GAMLS
- $75,0002 bd1 ba1k sqft1975 Tiger Flowers Dr NW, Atlanta, GA 30314ActiveMLS ID #10890353, Jeffrey Ducreay, eXp Realty. GAMLS
- $60,0003 bd3 ba1.3k sqft1939 Whitehall Forest Ct SE, Atlanta, GA 30316ActiveMLS ID #10699269, Jocelynn Vitar, eXp Realty. GAMLS
- $60,0002 bd2 ba984 sqft1993 Whitehall Forest Ct, Atlanta, GA 30316For SaleMLS ID #7587742, KATHLEEN WRIGHT, Realty Associates of Atlanta, LLC.. FMLS GA
- $60,0002 bd2 ba984 sqft1993 Whitehall Forest Ct SE, Atlanta, GA 30316ActiveMLS ID #10531703, Kathleen Wright, Realty Associates of Atlanta. GAMLS
- $73,0002 bd1 ba800 sqft140 Mount Zion Rd SE #61, Atlanta, GA 30354ActiveMLS ID #10868203, Japonica Goggins, Sapphire Realty Group. GAMLS
- $59,9002 bd1 ba1k sqft79 Peyton Pl SW, Atlanta, GA 30311ActiveMLS ID #10853978, Karryn S Bridges, The Bridges Firm, LLC. GAMLS
- $59,9002 bd2 ba1.1k sqft1660 Stanton Rd SW APT 4B, Atlanta, GA 30311ActiveMLS ID #10835517, Michael Tally, Tally Real Estate Group LLC. GAMLS
