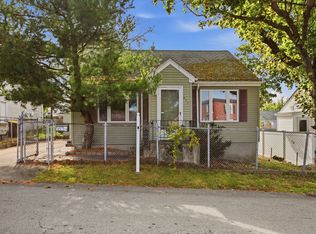
Welcome to 222 Albion Street! This charming and well-maintained 2-bedroom, 1-bath cottage offers comfortable, easy living in a convenient Fall River location. Step inside to a bright and inviting interior with a functional layout that makes great use of the space. The walk-out basement offers plenty of room for storage and added convenience. With public water and sewer, natural gas heat, and major updates already completed, this home is a great option for first-time buyers, downsizers, or anyone looking for a move-in-ready home without the upkeep of a larger property. Conveniently located near shopping, parks, public transportation, medical facilities, and highway access. Come see how much this sweet home has to offer!
For sale
$339,000
222 Albion St, Fall River, MA 02723
2beds
775sqft
Single Family Residence
Built in 1900
2,165 Square Feet Lot
$334,000 Zestimate®
$437/sqft
$-- HOA
What's special
Functional layoutBright and inviting interior
- 38 days
- 343
- 26
Zillow last checked:
Listing updated:
Listed by:
Melissa Neider 508-287-3948,
Peak Real Estate 774-704-6877
Source: MLS PIN,MLS#: 73580509
Facts & features
Interior
Bedrooms & bathrooms
- Bedrooms: 2
- Bathrooms: 1
- Full bathrooms: 1
Heating
- Baseboard, Natural Gas
Cooling
- Window Unit(s)
Appliances
- Included: Gas Water Heater, Range, Refrigerator
Features
- Flooring: Wood Laminate
- Basement: Walk-Out Access,Bulkhead
- Has fireplace: No
Interior area
- Total structure area: 775
- Total interior livable area: 775 sqft
- Finished area above ground: 775
Property
Lot
- Size: 2,165 Square Feet
- Features: Easements
Details
- Parcel number: M:000L B:0006 L:0127,4498335
- Zoning: G
Construction
Type & style
- Home type: SingleFamily
- Architectural style: Cottage
- Property subtype: Single Family Residence
Materials
- Foundation: Stone
- Roof: Shingle
Condition
- Year built: 1900
Utilities & green energy
- Sewer: Public Sewer
- Water: Public
- Utilities for property: for Gas Range
Green energy
- Energy generation: Solar
Community & HOA
Community
- Features: Public Transportation, Shopping, Park, Medical Facility, Laundromat, Highway Access, House of Worship, Marina, Private School, Public School, T-Station
HOA
- Has HOA: No
Location
- Region: Fall River
Financial & listing details
- Price per square foot: $437/sqft
- Tax assessed value: $265,800
- Annual tax amount: $3,051
- Date on market: 9/22/2026
Estimated market value
$334,000
$317,000 - $351,000
$1,850/mo
Price history
| Date | Event | Price |
|---|---|---|
| 9/21/2026 | Listed for sale | $339,000+14.1%$437/sqft |
Source: MLS PIN #73580509 Report a problem | ||
| 7/26/2024 | Sold | $297,000-0.7%$383/sqft |
Source: MLS PIN #73229711 Report a problem | ||
| 6/5/2024 | Price change | $299,000-0.3%$386/sqft |
Source: MLS PIN #73229711 Report a problem | ||
| 5/26/2024 | Price change | $299,999-1.6%$387/sqft |
Source: MLS PIN #73229711 Report a problem | ||
| 5/19/2024 | Price change | $304,900-1.6%$393/sqft |
Source: MLS PIN #73229711 Report a problem | ||
| 5/10/2024 | Price change | $309,999-3.1%$400/sqft |
Source: MLS PIN #73229711 Report a problem | ||
| 4/28/2024 | Listed for sale | $319,999+137%$413/sqft |
Source: MLS PIN #73229711 Report a problem | ||
| 2/15/2024 | Sold | $135,000-18.1%$174/sqft |
Source: MLS PIN #73162792 Report a problem | ||
| 1/25/2024 | Contingent | $164,900$213/sqft |
Source: MLS PIN #73162792 Report a problem | ||
| 11/29/2023 | Listed for sale | $164,900-2.9%$213/sqft |
Source: MLS PIN #73162792 Report a problem | ||
| 11/20/2023 | Contingent | $169,900$219/sqft |
Source: MLS PIN #73162792 Report a problem | ||
| 11/7/2023 | Price change | $169,900-10.5%$219/sqft |
Source: MLS PIN #73162792 Report a problem | ||
| 10/16/2023 | Price change | $189,900-5%$245/sqft |
Source: MLS PIN #73162792 Report a problem | ||
| 9/23/2023 | Listed for sale | $199,900+59.9%$258/sqft |
Source: MLS PIN #73162792 Report a problem | ||
| 6/9/2022 | Price change | $125,000-16.6%$161/sqft |
Source: MLS PIN #72987555 Report a problem | ||
| 5/25/2022 | Listed for sale | $149,900+50.1%$193/sqft |
Source: MLS PIN #72987555 Report a problem | ||
| 4/28/2018 | Listing removed | $99,900$129/sqft |
Source: Keller Williams Realty Easton #71871350 Report a problem | ||
| 9/25/2015 | Price change | $99,900-9.1%$129/sqft |
Source: Keller Williams - Easton #71871350 Report a problem | ||
| 7/11/2015 | Listed for sale | $109,900+86.9%$142/sqft |
Source: Keller Williams Realty #71871350 Report a problem | ||
| 3/2/2010 | Sold | $58,800$76/sqft |
Source: Public Record Report a problem | ||
| 7/31/2009 | Sold | $58,800+17.8%$76/sqft |
Source: Public Record Report a problem | ||
| 4/9/2009 | Listing removed | $49,900$64/sqft |
Source: foreclosure.com Report a problem | ||
| 3/20/2009 | Price change | $49,900-5.7%$64/sqft |
Source: foreclosure.com Report a problem | ||
| 1/31/2009 | Price change | $52,900-7%$68/sqft |
Source: foreclosure.com Report a problem | ||
| 1/27/2009 | Listed for sale | $56,900-59.4%$73/sqft |
Source: foreclosure.com Report a problem | ||
| 6/19/2006 | Sold | $140,301+1.7%$181/sqft |
Source: Public Record Report a problem | ||
| 12/22/2003 | Sold | $138,000$178/sqft |
Source: Public Record Report a problem | ||
Public tax history
| Year | Property taxes | Tax assessment |
|---|---|---|
| 2025 | $2,866 +5.9% | $250,300 +6.3% |
| 2024 | $2,706 +10.8% | $235,500 +18.3% |
| 2023 | $2,442 +6.7% | $199,000 +9.7% |
| 2022 | $2,289 +6% | $181,400 +16.1% |
| 2021 | $2,160 -1.4% | $156,200 +3% |
| 2020 | $2,191 +4% | $151,600 +4.9% |
| 2019 | $2,107 +2.9% | $144,500 +3.2% |
| 2018 | $2,047 +7.7% | $140,000 +3.2% |
| 2017 | $1,900 +1.7% | $135,700 -1% |
| 2016 | $1,869 +4.2% | $137,100 |
| 2015 | $1,793 +5.8% | $137,100 +1.8% |
| 2014 | $1,695 +1.8% | $134,700 -3.5% |
| 2013 | $1,665 +3.3% | $139,600 -4.9% |
| 2012 | $1,612 +5.3% | $146,800 -13.3% |
| 2010 | $1,531 +20.6% | $169,400 +7.6% |
| 2009 | $1,269 -6.1% | $157,500 -10.6% |
| 2008 | $1,351 +6.8% | $176,200 |
| 2007 | $1,265 -28.1% | $176,200 -31.6% |
| 2006 | $1,759 +4.4% | $257,500 +16.3% |
| 2005 | $1,685 -5.3% | $221,400 +2.2% |
| 2004 | $1,779 +3.2% | $216,700 +34.6% |
| 2003 | $1,724 +8.8% | $161,000 |
| 2002 | $1,584 -0.3% | $161,000 +6% |
| 2000 | $1,589 +18.1% | $151,900 +3.6% |
| 1995 | $1,346 | $146,600 |
Find assessor info on the county website
Monthly payment
Est. payment
Payment breakdown
Explore the cost of this home by adjusting the details. Changes won't be saved.Climate risks
Neighborhood: Flint


Similar homes
- $349,0002 bd1 ba1k sqft2113 Pleasant St, Fall River, MA 02723For Sale
 MLS ID #73587066, Julie Ruggeiro, New Road Realty. MLS PIN
- $399,8004 bd2 ba1k sqft97 Canonicus St, Fall River, MA 02723For Sale
 MLS ID #73587106, Jenna Danielli, LPT Realty - Home & Key Group. MLS PIN
- $299,0003 bd1 ba1k sqft471 Pokross St, Fall River, MA 02724For Sale
 MLS ID #73597048, Joy Gilkeson, Keller Williams Coastal. MLS PIN
- $325,0002 bd1 ba900 sqft87 High St Lot 1, Assonet, MA 02702For Sale
 MLS ID #73595571, Cindy Brouwer, Cindy Brouwer Real Estate. MLS PIN
- $384,5002 bd1 ba963 sqft47 Restful Valley Rd, Tiverton, RI 02878For Sale
 MLS ID #1422572, Dory Skemp, Residential Properties Ltd.. StateWide MLS RI
- $289,9002 bd2 ba1k sqft26 Bluebird Dr, Tiverton, RI 02878For SaleMLS ID #1425830, Bill Iannucci, Century 21 Topsail Realty. StateWide MLS RI
