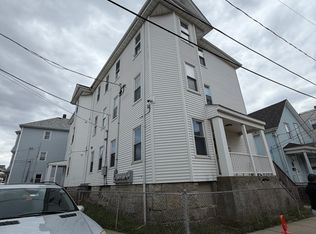
*Motivated seller!* Add to your portfolio with this two-family property offering an excellent opportunity for investors or anyone looking to build equity and generate rental income. Each unit features 2 bedrooms, separate utilities, and a newer roof. Whether you're looking for your next rental property, a value-add opportunity, or the chance to live in one unit while generating income from the other, this property offers plenty of potential.
For sale
$399,800
97 Canonicus St, Fall River, MA 02723
4beds
1,068sqft
Multi Family
Built in 1930
-- sqft lot
$392,100 Zestimate®
$374/sqft
$-- HOA
What's special
Newer roof
- 37 days
- 533
- 48
Zillow last checked:
Listing updated:
Listed by:
Jenna Danielli 508-985-3157,
LPT Realty - Home & Key Group 877-366-2213
Source: MLS PIN,MLS#: 73587106
Facts & features
Interior
Bedrooms & bathrooms
- Bedrooms: 4
- Bathrooms: 2
- Full bathrooms: 2
Heating
- Natural Gas
Cooling
- None
Appliances
- Included: Range, Oven, Microwave
Features
- Living Room, Kitchen, Family Room
- Flooring: Wood
- Basement: Full
- Has fireplace: No
Interior area
- Total structure area: 1,068
- Total interior livable area: 1,068 sqft
- Finished area above ground: 1,068
Property
Parking
- Parking features: Paved Drive
- Has uncovered spaces: Yes
Lot
- Size: 2,413 Square Feet
Details
- Parcel number: M:000K B:0014 L:0017,2830068
- Zoning: N/A
Construction
Type & style
- Home type: MultiFamily
- Property subtype: Multi Family
Materials
- Foundation: Brick/Mortar
- Roof: Shingle
Condition
- Year built: 1930
Utilities & green energy
- Sewer: Public Sewer
- Water: Public
- Utilities for property: for Gas Range, for Gas Oven
Community & HOA
Community
- Features: Public Transportation, Shopping
Location
- Region: Fall River
Financial & listing details
- Price per square foot: $374/sqft
- Tax assessed value: $272,000
- Annual tax amount: $3,123
- Date on market: 10/6/2026
- Listing terms: Seller W/Participate
- Total actual rent: 2400
- Road surface type: Paved
Estimated market value
$392,100
$372,000 - $412,000
$2,238/mo
Price history
| Date | Event | Price |
|---|---|---|
| 10/6/2026 | Listed for sale | $399,800+131.8%$374/sqft |
Source: MLS PIN #73587106 Report a problem | ||
| 5/26/2020 | Sold | $172,500+1.5%$162/sqft |
Source: Public Record Report a problem | ||
| 2/11/2020 | Listing removed | $170,000$159/sqft |
Source: Lion Gate Real Estate, Inc. #72582941 Report a problem | ||
| 1/29/2020 | Pending sale | $170,000$159/sqft |
Source: Lion Gate Real Estate, Inc. #72582941 Report a problem | ||
| 1/2/2020 | Price change | $170,000-2.8%$159/sqft |
Source: Lion Gate Real Estate, Inc. #72582941 Report a problem | ||
| 12/23/2019 | Price change | $174,900-2.8%$164/sqft |
Source: Lion Gate Real Estate, Inc. #72582941 Report a problem | ||
| 12/16/2019 | Price change | $180,000-2.7%$169/sqft |
Source: Lion Gate Real Estate, Inc. #72582941 Report a problem | ||
| 11/25/2019 | Price change | $185,000-2.1%$173/sqft |
Source: Lion Gate Real Estate, Inc. #72582941 Report a problem | ||
| 11/16/2019 | Price change | $189,000-5%$177/sqft |
Source: Lion Gate Real Estate, Inc. #72582941 Report a problem | ||
| 11/11/2019 | Price change | $199,000-4.8%$186/sqft |
Source: Lion Gate Real Estate, Inc. #72582941 Report a problem | ||
| 10/28/2019 | Price change | $209,000-5%$196/sqft |
Source: Lion Gate Real Estate, Inc. #72582941 Report a problem | ||
| 10/21/2019 | Listed for sale | $219,900+83.3%$206/sqft |
Source: Lion Gate Real Estate, Inc. #72582941 Report a problem | ||
| 10/4/2019 | Sold | $120,000+92%$112/sqft |
Source: Public Record Report a problem | ||
| 3/19/2010 | Sold | $62,500-17.5%$59/sqft |
Source: Public Record Report a problem | ||
| 11/17/2009 | Listing removed | $75,800$71/sqft |
Source: Nick Helgesen #71001108 Report a problem | ||
| 11/15/2009 | Listed for sale | $75,800-42.5%$71/sqft |
Source: Nick Helgesen #71001108 Report a problem | ||
| 11/13/2009 | Sold | $131,750+1.4%$123/sqft |
Source: Public Record Report a problem | ||
| 4/4/2009 | Listing removed | $129,900$122/sqft |
Source: MLS Property Information Network #70802148 Report a problem | ||
| 11/10/2008 | Price change | $129,900-18.8%$122/sqft |
Source: MLS Property Information Network #70802148 Report a problem | ||
| 8/6/2008 | Listed for sale | $159,900-3.1%$150/sqft |
Source: MLS Property Information Network #70802148 Report a problem | ||
| 5/19/2006 | Sold | $165,000+108.9%$154/sqft |
Source: Public Record Report a problem | ||
| 8/7/1989 | Sold | $79,000$74/sqft |
Source: Public Record Report a problem | ||
Public tax history
| Year | Property taxes | Tax assessment |
|---|---|---|
| 2025 | $2,911 +9.4% | $254,200 +9.8% |
| 2024 | $2,660 +15.4% | $231,500 +23.2% |
| 2023 | $2,306 +6.9% | $187,900 +9.9% |
| 2022 | $2,158 -1.9% | $171,000 +7.5% |
| 2021 | $2,199 +16.1% | $159,000 +21.3% |
| 2020 | $1,894 +4.5% | $131,100 +5.5% |
| 2019 | $1,812 +1.6% | $124,300 +1.9% |
| 2018 | $1,784 +2.4% | $122,000 -1.9% |
| 2017 | $1,742 -7.4% | $124,400 -9.9% |
| 2016 | $1,881 +6.8% | $138,000 +2.5% |
| 2015 | $1,761 -2.9% | $134,600 -6.6% |
| 2014 | $1,813 -6.6% | $144,100 -11.4% |
| 2013 | $1,941 +7.1% | $162,700 -1.4% |
| 2012 | $1,812 +10.9% | $165,000 -8.7% |
| 2010 | $1,634 +3.3% | $180,700 -7.9% |
| 2009 | $1,582 -2.3% | $196,300 -7.1% |
| 2008 | $1,620 +5.2% | $211,200 -1.5% |
| 2007 | $1,540 +25.5% | $214,500 +19.4% |
| 2006 | $1,227 +6.5% | $179,700 +18.7% |
| 2005 | $1,152 +11.4% | $151,400 +20.3% |
| 2004 | $1,034 +19.1% | $125,900 +55.4% |
| 2003 | $868 +8.9% | $81,000 |
| 2002 | $797 -5.9% | $81,000 |
| 2000 | $847 +31.5% | $81,000 +15.4% |
| 1995 | $644 | $70,200 |
Find assessor info on the county website
Monthly payment
Est. payment
Payment breakdown
Explore the cost of this home by adjusting the details. Changes won't be saved.Climate risks
Neighborhood: Flint


Similar homes
- $425,0004 bd2 ba1.1k sqft157 Denver St, Fall River, MA 02721For Sale
 MLS ID #73564195, Manny V Lindo, Highland Real Estate Group. MLS PIN
- $395,0003 bd1 ba886 sqft452 Tecumseh St, Fall River, MA 02721For Sale
 MLS ID #73534831, TJ George, RE/MAX Platinum. MLS PIN
- $410,0003 bd2 ba1.2k sqft96 Star St, Fall River, MA 02724For Sale
 MLS ID #73504413, Emanuel Galante, Keller Williams South Watuppa. MLS PIN
- $339,0002 bd1 ba1k sqft2113 Pleasant St, Fall River, MA 02723For Sale
 MLS ID #73587066, Julie Ruggeiro, New Road Realty. MLS PIN
