I have room for rent
Month to month
Pre-foreclosure
Street View
Est. $368,400
2356 W Hays St, Banning, CA 92220
3beds
1,300sqft
Single Family Residence
Built in ----
-- sqft lot
$368,400 Zestimate®
$283/sqft
$-- HOA
Overview
- 58 days
- 34
- 3
Zillow last checked:
Listing updated:
Source: Zillow Rentals
Facts & features
Interior
Bedrooms & bathrooms
- Bedrooms: 3
- Bathrooms: 1
- Full bathrooms: 1
Cooling
- Air Conditioner, Central Air
Appliances
- Included: Oven, Refrigerator
- Laundry: None
Features
- Flooring: Hardwood
Interior area
- Total interior livable area: 1,300 sqft
Property
Parking
- Parking features: Detached, Garage, Off Street
- Has garage: Yes
- Details: Contact manager
Details
- Additional structures: Garage(s)
- Parcel number: 538162002
Construction
Type & style
- Home type: SingleFamily
- Property subtype: Single Family Residence
Community & HOA
Community
- Deposit fee: $400
Location
- Region: Banning
Financial & listing details
- Price per square foot: $283/sqft
- Tax assessed value: $358,938
- Date on market: 9/21/2026
- Date available: 09/21/2026
- Lease term: Sublet/Temporary
Foreclosure details
Estimated market value
$368,400
$339,000 - $394,000
$1,886/mo
Price history
| Date | Event | Price |
|---|---|---|
| 2/14/2026 | Listing removed | $3,000$2/sqft |
Source: Zillow Rentals Report a problem | ||
| 1/31/2026 | Price change | $3,000-14.3%$2/sqft |
Source: Zillow Rentals Report a problem | ||
| 1/23/2026 | Listed for rent | $3,500+6.1%$3/sqft |
Source: Zillow Rentals Report a problem | ||
| 12/24/2025 | Listing removed | $3,300$3/sqft |
Source: Zillow Rentals Report a problem | ||
| 12/19/2025 | Price change | $3,300-5.7%$3/sqft |
Source: Zillow Rentals Report a problem | ||
| 12/10/2025 | Listed for rent | $3,500$3/sqft |
Source: Zillow Rentals Report a problem | ||
| 7/10/2025 | Listing removed | $395,000$304/sqft |
Source:  Greater Palm Springs Realtors #219127654 Report a problem | ||
| 6/5/2025 | Price change | $395,000-12%$304/sqft |
Source: Greater Palm Springs Realtors #219127654 Report a problem | ||
| 5/14/2025 | Price change | $449,000+5.6%$345/sqft |
Source: Greater Palm Springs Realtors #219127654 Report a problem | ||
| 4/24/2025 | Price change | $425,000-5.3%$327/sqft |
Source: Greater Palm Springs Realtors #219127654 Report a problem | ||
| 4/2/2025 | Listed for sale | $449,000+30.1%$345/sqft |
Source: Greater Palm Springs Realtors #219127654 Report a problem | ||
| 12/5/2023 | Sold | $345,000+23.2%$265/sqft |
Source: Public Record Report a problem | ||
| 10/18/2023 | Sold | $280,000+34%$215/sqft |
Source: Public Record Report a problem | ||
| 10/9/2018 | Sold | $209,000+16.1%$161/sqft |
Source: Public Record Report a problem | ||
| 7/23/2018 | Sold | $180,000-10%$138/sqft |
Source: Public Record Report a problem | ||
| 6/21/2018 | Pending sale | $199,900$154/sqft |
Source: CENTURY 21 Osborne Realty #ev18125364 Report a problem | ||
| 5/27/2018 | Listed for sale | $199,900$154/sqft |
Source: CENTURY 21 OSBORNE REALTY #EV18125364 Report a problem | ||
Public tax history
| Year | Property taxes | Tax assessment |
|---|---|---|
| 2026 | -- | $358,938 +2% |
| 2025 | $5,136 +7% | $351,900 +2% |
| 2024 | $4,799 +23.5% | $345,000 +54% |
| 2023 | $3,887 +28.1% | $224,087 +2% |
| 2022 | $3,035 +2% | $219,694 +2% |
| 2021 | $2,975 +0.3% | $215,387 +1% |
| 2020 | $2,968 -1% | $213,179 +2% |
| 2019 | $2,999 +959.2% | $209,000 +819% |
| 2018 | $283 +2.8% | $22,741 +2% |
| 2017 | $275 | $22,296 +2% |
| 2016 | $275 +7.5% | $21,859 +1.5% |
| 2015 | $256 +1.5% | $21,533 +2% |
| 2014 | $253 | $21,114 +0.4% |
| 2013 | -- | $21,020 +2% |
| 2012 | -- | $20,609 +2% |
| 2011 | -- | $20,206 +0.7% |
| 2010 | -- | $20,057 -0.2% |
| 2009 | -- | $20,106 +2% |
| 2008 | -- | $19,713 +2% |
| 2007 | -- | $19,327 +2% |
| 2006 | -- | $18,949 +2% |
| 2005 | -- | $18,579 +3.9% |
| 2003 | -- | $17,884 +2% |
| 2002 | -- | $17,534 +2% |
| 2001 | $123 +3.3% | $17,191 +2% |
| 2000 | $119 | $16,855 |
Find assessor info on the county website
Monthly payment
Climate risks
Neighborhood: 92220

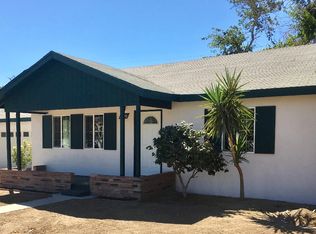
Similar homes
- $325,0003 bd2 ba1k sqft651 N 19th St, Banning, CA 92220For Sale
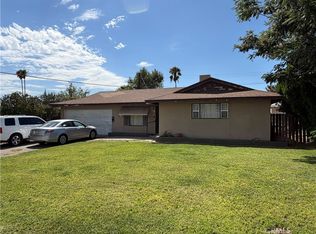 MLS ID #IG26186149, Russ Rigsby, REAL ESTATE MASTERS GROUP. CRMLS
- $425,0003 bd2 ba1.3k sqft2174 W Lincoln St, Banning, CA 92220For Sale
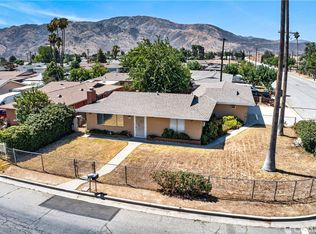 MLS ID #IG26156881, Benjamin Escalera, Berkshire Hathaway Homeservices California Realty. CRMLS
- $353,9002 bd1 ba860 sqft3135 W George St, Banning, CA 92220For Sale
 MLS ID #IG26175383, Benjamin Escalera, Berkshire Hathaway Homeservices California Realty. CRMLS
- $372,7502 bd2 ba1.7k sqft753 Amber Sky St, Banning, CA 92220For Sale
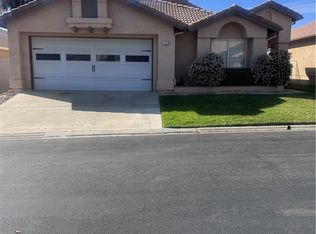 MLS ID #IG26033859, Veronica Hollenbaugh, VERONICA HOLLENBAUGH R.E. SERV. CRMLS
