$132,200
2 bd1 ba768 sqft
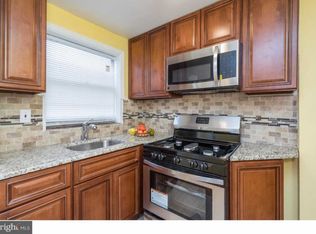
240 Margate Rd, Upper Darby, PA 19082
Off Market
Zillow last checked:
Listing updated:
Ari Miller 215-914-0700,
Real Estate Management Advisors LLC 2159140700
$142,400
$135,000 - $150,000
$1,474/mo
| Date | Event | Price |
|---|---|---|
| 6/17/2026 | Listed for rent | $1,660$2/sqft |
Source: Zillow Rentals Report a problem | ||
| 6/15/2026 | Listing removed | $1,660$2/sqft |
Source: Zillow Rentals Report a problem | ||
| 6/13/2026 | Listed for rent | $1,660+23%$2/sqft |
Source: Zillow Rentals Report a problem | ||
| 6/12/2026 | Listed for sale | $149,000+272.5%$194/sqft |
Source: | ||
| 3/4/2025 | Listing removed | $1,350$2/sqft |
Source: Zillow Rentals Report a problem | ||
| 2/11/2025 | Price change | $1,350-1.8%$2/sqft |
Source: Zillow Rentals Report a problem | ||
| 1/14/2025 | Listed for rent | $1,375$2/sqft |
Source: Zillow Rentals Report a problem | ||
| 1/4/2025 | Listing removed | $1,375$2/sqft |
Source: Zillow Rentals Report a problem | ||
| 1/1/2025 | Listed for rent | $1,375$2/sqft |
Source: Zillow Rentals Report a problem | ||
| 12/16/2023 | Listing removed | -- |
Source: Zillow Rentals Report a problem | ||
| 12/5/2023 | Listed for rent | $1,375+5.8%$2/sqft |
Source: Zillow Rentals Report a problem | ||
| 9/8/2022 | Listing removed | -- |
Source: Zillow Rental Network Premium Report a problem | ||
| 9/6/2022 | Price change | $1,300+0.4%$2/sqft |
Source: Zillow Rental Network Premium Report a problem | ||
| 9/2/2022 | Listed for rent | $1,295+3.6%$2/sqft |
Source: Zillow Rental Network Premium Report a problem | ||
| 9/11/2021 | Listing removed | -- |
Source: Zillow Rental Network Premium Report a problem | ||
| 9/8/2021 | Price change | $1,250+2%$2/sqft |
Source: Zillow Rental Network Premium Report a problem | ||
| 9/5/2021 | Listed for rent | $1,225$2/sqft |
Source: Zillow Rental Network Premium Report a problem | ||
| 6/24/2021 | Sold | $40,000$52/sqft |
Source: Public Record Report a problem | ||
| Year | Property taxes | Tax assessment |
|---|---|---|
| 2025 | $2,907 +3.5% | $66,410 |
| 2024 | $2,809 +1% | $66,410 |
| 2023 | $2,782 +2.8% | $66,410 |
| 2022 | $2,707 | $66,410 |
| 2021 | $2,707 +1149% | $66,410 +67.3% |
| 2020 | $217 -91.4% | $39,690 |
| 2019 | $2,522 +1.2% | $39,690 |
| 2018 | $2,493 +1044.8% | $39,690 |
| 2017 | $218 | $39,690 |
| 2016 | $218 | $39,690 |
| 2015 | $218 -2% | $39,690 |
| 2014 | $222 +4.8% | $39,690 |
| 2013 | $212 +0.8% | $39,690 |
| 2012 | $210 +2.3% | $39,690 |
| 2011 | $206 | $39,690 |
| 2010 | $206 +9.7% | $39,690 |
| 2009 | $187 | $39,690 |
| 2008 | $187 +6.1% | $39,690 |
| 2007 | $177 | $39,690 |
| 2006 | $177 | $39,690 |
| 2005 | $177 | $39,690 |
| 2004 | $177 +8.5% | $39,690 |
| 2003 | $163 +7.9% | $39,690 |
| 2002 | $151 | $39,690 |
| 2000 | $151 | $39,690 |
Source: Bright MLS. This data may not be complete. We recommend contacting the local school district to confirm school assignments for this home.
A local agent can set up tours, give advice and negotiate with sellers.


